

Next: Aerogel Cerenkov Counter System,
Up: Central Tracking Chamber, CDC
Previous: Cathode strip detector
Contents
The Belle experiment has been taking data at the  (4S)
resonance energy since June 1999. In order to operate CDC in the high
beam-background environment, we readjusted high voltages and
electronics parameters such as the bias voltage of the preamplifiers.
These changes reduce cross-talk noise hits caused by the very large
signals due to background particles spiraling around sense wires.
These changes also reduced the preamplifier gains and slowed their
response times. The calibration constants were recalculated using the
beam data. In addition, corrections for the additional magnetic field
non-uniformity caused by the accelerator magnet components near the
interaction region were introduced into the Kalman filter using a
magnetic field map data measured with these magnets in place. We again
obtained 130
  m overall spatial resolution, although the residual
distribution has considerable non-Gaussian tails.
We analysed
 events, detected as two
charged tracks by CDC and identified as muons by the outer detectors,
to extract the
  resolution of CDC. We can calculate the
  resolution using the fact that each muon track has the same momentum
in the cm system. The
  resolution measured is 1.64
  0.04 %
in the
  range from 4 to 5.2 GeV/c, which is imposed by kinematics
and the acceptance of the TOF system used for triggering. This result
is somewhat worse than the resolution of 1.38 % expected from Monte
Carlo simulations.
The
  dependence of the
  resolution has been checked
with
 events. No significant
 -dependent systematic effects were observed.
The
  mass was reconstructed from
 decays in hadronic events in order to check the
  resolution at
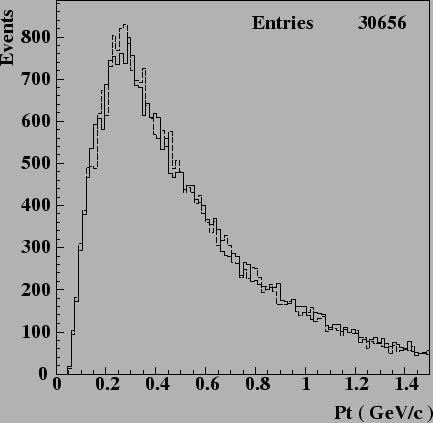
low momenta. Most of the decay pions have momenta below 1 GeV/c as
shown in
Fig.
 ![[*]](./icons/crossref.png) .
Fig.
.
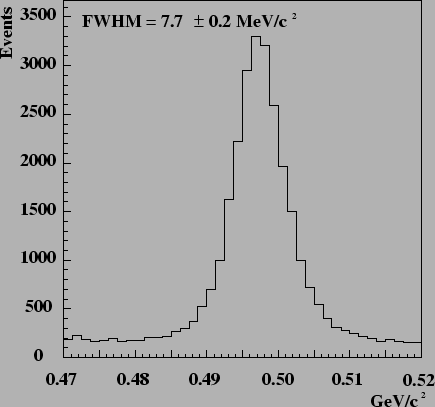
Fig. ![[*]](./icons/crossref.png) shows a
shows a  invariant mass
distribution. The FWHM of the distribution is 7.7 MeV/
 , which is
slightly worse than the idealized Monte Carlo prediction of 6.9
MeV/
 .
.
Figure:
Transverse momentum distributions for pions from  decays. The solid and dashed histograms correspond to
  and
and
 tracks, respectively.
 |
Figure:
Inclusive
 mass distribution
for multi hadronic events.
 |
The truncated-mean method was employed to estimate the most probable
energy loss. The largest 20 % of measured  values for each
track were discarded and the remaining data were averaged in order to
minimize occasional large fluctuations in the Landau tail of the
 distribution. As described in Section of the beam
test [36], the
  thus obtained is expected
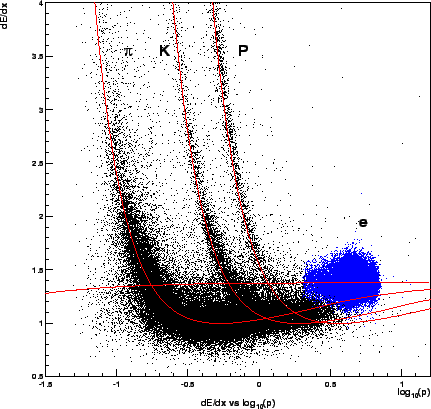
to give a resolution of 5 %. A scatter plot of measured
  and particle momentum is shown in
Fig.
 ![[*]](./icons/crossref.png) , together with the expected mean energy
losses for different particle species. Populations of pions, kaons,
protons, and electrons can be clearly seen. The normalized
, together with the expected mean energy
losses for different particle species. Populations of pions, kaons,
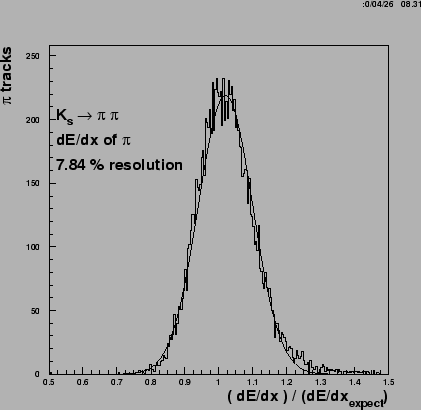
protons, and electrons can be clearly seen. The normalized  distribution for minimum ionizing pions from
  decays is shown
in
Fig.
 ![[*]](./icons/crossref.png) . The
. The  resolution was measured to be
7.8 % in the momentum range from 0.4 to 0.6 GeV/c, while the
resolution for Bhabha and
  -pair events was about 6 %. These
results are somewhat worse than the Monte Carlo results.
At present the resolutions obtained from the beam data seem to be
slightly worse than those expected from the cosmic ray data and Monte
Carlo simulations. Although the present performance level of CDC
provides the momentum resolution sufficient for the goals of the Belle
experiment, efforts to further improve CDC performance are being made.
Figure:
Truncated mean of  versus momentum observed in
collision data.
 |
Figure:
Distribution of
 for pions from
 decays.
 |


Next: Aerogel Cerenkov Counter System,
Up: Central Tracking Chamber, CDC
Previous: Cathode strip detector
Contents
Samo Stanic
2001-06-02

