

Next: Electromagnetic Calorimetry, ECL
Up: Performance
Previous: Calibration and time resolution
Contents
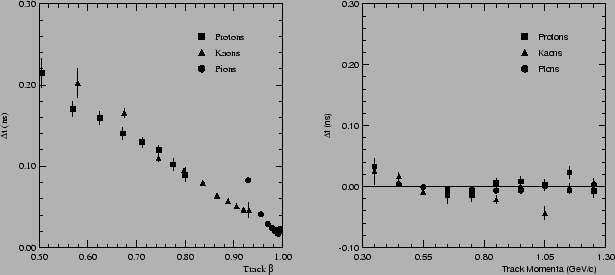
After the calibration constants (TWC), optimized on  -pair events,
were applied to hadronic events, sizeable deviations from zero for the
 residuals were observed. In particular the deviations were
found to be momentum dependent and different for each of the hadron
species. Deviations were observed as large as two sigma away from zero
for low momentum tracks identified as kaons and protons by other
detector subsystems. Further investigation revealed that the observed
momentum and hadronic species dependence could in fact be reasonably
modeled by a single linear function in terms of the track's velocity,
see the left side of Fig.
 ![[*]](./icons/crossref.png) . A velocity or
. A velocity or
 parameterization was then applied in the TOF reconstruction
algorithm to correct for this effect. The
  parameterization was
determined from an analysis of a large sample of hadronic events. In
the right side of Fig.
 ![[*]](./icons/crossref.png) we show the momentum
distribution of the
we show the momentum
distribution of the  residual after the application of the
 correction. The large
  systematics observed earlier
were largely removed over the relevant momentum range and for each of
the hadron types. Further study is planned to establish the origin of
the velocity dependence in the
  distribution.
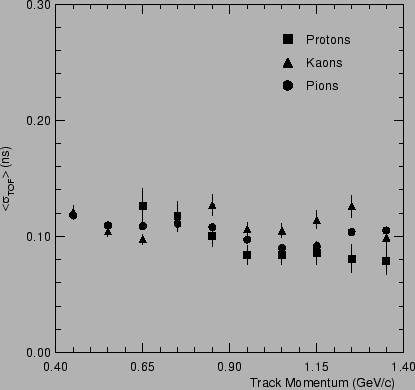
Fig.
 ![[*]](./icons/crossref.png) shows the TOF resolution averaged
over all counters and
shows the TOF resolution averaged
over all counters and  as a function of momentum for each hadron
species.
Figure:
Systematics of TOF  residuals. The figure on the
left shows the
  dependence of the
  residual after
application of the
  -pair optimized calibration constants but
before the
  correction for each hadron species. The figure on
the right shows the distribution of the residuals as a function of
momentum after application of all calibration constants.
 |
Figure:
The TOF resolution, averaged over all counters and  , as a
function of momentum for each hadron species.
 |
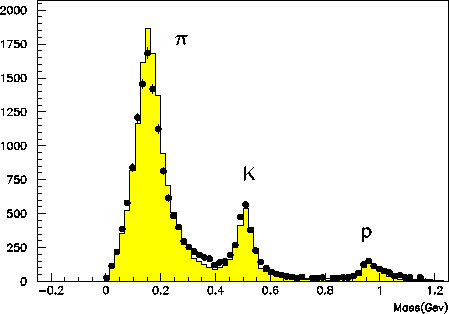
Figure ![[*]](./icons/crossref.png) shows the mass distribution for each
track in hadron events, calculated using the equation
shows the mass distribution for each
track in hadron events, calculated using the equation
 |
(5) |
where  and
and  are the momentum and path length of the
particle determined from the CDC track fit assuming the muon mass,
respectively. Clear peaks corresponding to
  ,
,  and
protons are seen. The data points are in good agreement with a Monte
Carlo prediction (histogram) obtained by assuming
  = 100
ps.
Figure:
Mass distribution from TOF measurements for particle momenta
below 1.2 GeV/c.
 |
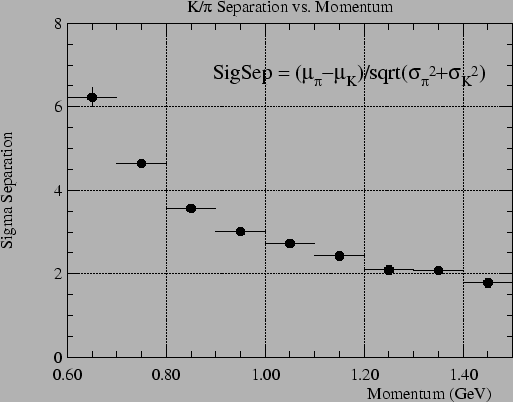
The identification power of
 separation is shown in
Fig.
 ![[*]](./icons/crossref.png) as a function of momentum. The
identification power is defined as
as a function of momentum. The
identification power is defined as
 |
(6) |
where  and
and  are the time resolution for
  and
and  , respectively, at each momentum. This demonstrates clear
2
 separation for particle momenta up to 1.25 GeV/c.
Figure:
 separation by TOF.
 |


Next: Electromagnetic Calorimetry, ECL
Up: Performance
Previous: Calibration and time resolution
Contents
Samo Stanic
2001-06-02


