


Next: Calibration with Cosmic Rays
Up: Central Tracking Chamber, CDC
Previous: Electronics
Contents
A real-size prototype of Belle CDC was constructed and used in a beam
test to study the gas-gain saturation effect in  measurements.
The chamber is 235 cm long, and the inner and outer radii are 25 cm to
90 cm, respectively. It has 41 layers of sense wires, 9 layers fewer
than the final design [36]. A beam test was carried
out at the
measurements.
The chamber is 235 cm long, and the inner and outer radii are 25 cm to
90 cm, respectively. It has 41 layers of sense wires, 9 layers fewer
than the final design [36]. A beam test was carried
out at the  2 beam line. The chamber was placed in a null magnetic
field. The drift time was measured by a LeCroy FASTBUS TDC 1876 and
the total charge was integrated by a LeCroy FASTBUS 1885F.
The measured spatial resolution was 120
2 beam line. The chamber was placed in a null magnetic
field. The drift time was measured by a LeCroy FASTBUS TDC 1876 and
the total charge was integrated by a LeCroy FASTBUS 1885F.
The measured spatial resolution was 120  150
150  m depending on
the layer and incident angles in the direction perpendicular to the
wires.
m depending on
the layer and incident angles in the direction perpendicular to the
wires.
For the measurement we took the truncated mean in order to
minimize the contribution of the Landau tail in the
distribution. In the analysis of this section 80 % truncated means
are used to measure . The resolution was obtained to be
5.2 % for 3.5 GeV/c pions at an incident angle of  .
Fig.
.
Fig. ![[*]](./icons/crossref.png) shows measured distributions as a
function of
shows measured distributions as a
function of  . The solid curve is a fit to the data at an
angle of , based on the most-probable energy loss
formula [36]. The density correction term
. The solid curve is a fit to the data at an
angle of , based on the most-probable energy loss
formula [36]. The density correction term  was parameterized to fit the electron data. The dashed curve
corresponds to the case of = 0.
was parameterized to fit the electron data. The dashed curve
corresponds to the case of = 0.
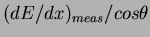
Figure:
(a) Measured vs. and (b) the same as
(a),but normalized with the measured by 3.5 GeV/c protons
( = 3.73). The solid curve is a fit to the data at an
incident angle of 45 , and the dashed curve is that with =
0.
, and the dashed curve is that with =
0.
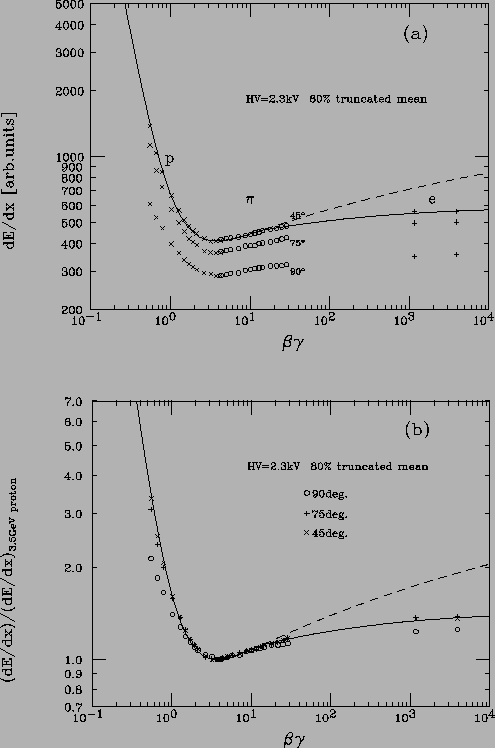 |
The incident angle dependence of was measured. The normalized
distributions to values calculated from the fit
obtained for the incident angle of decrease with increasing
incident angles. This indicates a clear space charge effect. The
gas-gain saturation effect is mainly determined by the projected ion
pair density produced by the incident particles.
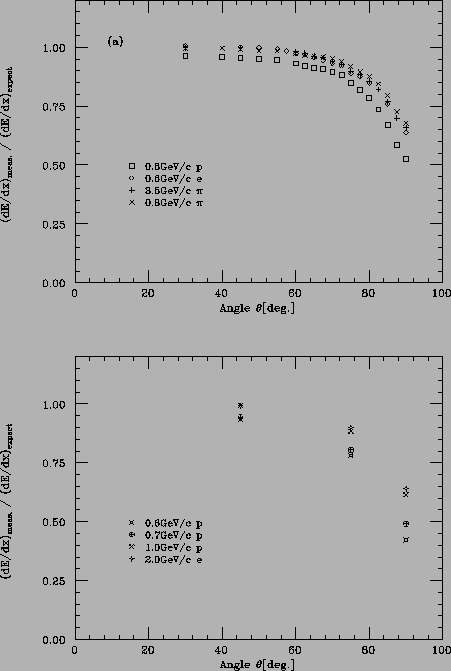
Fig. shows distributions of
 vs.
vs.
 for various beam conditions. The
  -axis corresponds to the
projected ion pair density and the magnitude of the
-axis corresponds to the
projected ion pair density and the magnitude of the  -axis is
essentially independent of incident particles.
-axis is
essentially independent of incident particles.
Figure:
(a)
 vs.
vs.
 (avalanche density on the sense wire)
for 0.8 GeV/c protons, 0.8 GeV/c pions, 0.6 GeV/c electrons and 3.5
GeV/c pions, and (b)
vs.
for 0.6, 0.7 and 1.0 GeV/c protons and
2.0 GeV/c electrons. The solid curves are the fit results. The 90
data are treated separately.
(avalanche density on the sense wire)
for 0.8 GeV/c protons, 0.8 GeV/c pions, 0.6 GeV/c electrons and 3.5
GeV/c pions, and (b)
vs.
for 0.6, 0.7 and 1.0 GeV/c protons and
2.0 GeV/c electrons. The solid curves are the fit results. The 90
data are treated separately.
 |
It is important to correct data for the space charge effect to
maintain the particle identification performance expected from the
obtained resolution and dependence of .
Next: Calibration with Cosmic Rays
Up: Central Tracking Chamber, CDC
Previous: Electronics
Contents
Samo Stanic
2001-06-02