

Next: Particle Identification of Electrons
Up: Aerogel Cerenkov Counter System,
Previous: Monte Carlo simulation
Contents
The performance of prototype ACC modules has been tested using the
 2 beam line at KEK PS.
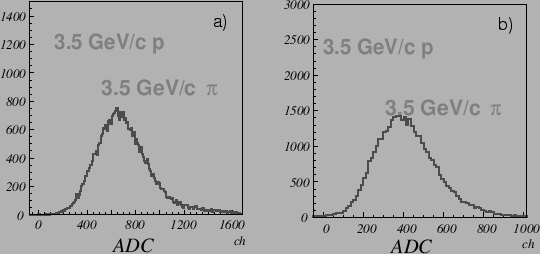
Typical pulse-height distributions for 3.5 GeV/c pions and protons
measured by an aerogel counter, with
  = 1.015 and read by two 2.5
in. FM-PMTs, are shown in
Figs.
 ![[*]](./icons/crossref.png) (a) and (b), with and without a magnetic
field of 1.5 T, respectively. The number of photoelectrons (
(a) and (b), with and without a magnetic
field of 1.5 T, respectively. The number of photoelectrons ( )
for 3.5 GeV/c negative pions is measured to be 20.3. In the case of
Fig.
 ![[*]](./icons/crossref.png) (b) we used a preamplifier and applied a
higher HV to get almost the same gain as that without a magnetic
field. Pions and protons are clearly separated by more than
3
(b) we used a preamplifier and applied a
higher HV to get almost the same gain as that without a magnetic
field. Pions and protons are clearly separated by more than
3 . It was found that cracks in the aerogel do not make a
difference in the light yield.
Figure:
Pulse-height spectra for 3.5 GeV/c pions (above threshold)
and protons (below threshold) obtained by a single module of ACC in
(a) non-magnetic field and (b) a magnetic field of 1.5 T. Silica
aerogels with  = 1.015 were stacked to form the module.
 |
Figure:
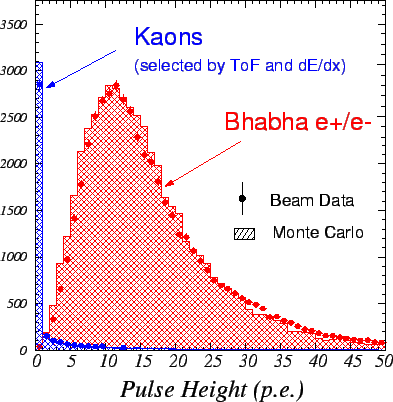
Pulse-height spectra in units of photoelectrons observed by
barrel ACC for electrons and kaons. Kaon candidates were obtained by
 and TOF measurements. The Monte Carlo expectations are
superimposed.
 |
After ACC was installed into the Belle detector in December 1998, the
initial calibration of the detector was carried out using cosmic
rays. The Belle detector has been rolled into the interaction point
and commissioned with  beams since May 1999.
Figure ![[*]](./icons/crossref.png) shows the measured pulse height
distribution for the barrel ACC for
shows the measured pulse height
distribution for the barrel ACC for  tracks in Bhabha events
and also
  candidates in hadronic events, which are selected
by TOF and
  measurements [53]. The
figure demonstrates a clear separation between high energy electrons
and below-threshold particles. It also indicates good agreement
between the data and Monte Carlo simulations [52].
A careful calibration for the pulse height of each FM-PMT signal has
been performed with  -pair events.
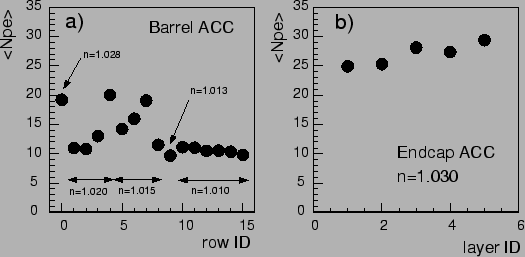
Figs.
 ![[*]](./icons/crossref.png) (a) and (b) show the average number
of photoelectrons
(a) and (b) show the average number
of photoelectrons  for each counter row in the barrel ACC
and each layer of the end-cap ACC, respectively. In the barrel ACC
each row has on average 60 boxes and the row number is given from left
to right in Fig.
 ![[*]](./icons/crossref.png) . The layer number of the
end-cap ACC is given from the inner to the outer side. The light yield
for the
. The layer number of the
end-cap ACC is given from the inner to the outer side. The light yield
for the  tracks depends on the refractive index of aerogel
radiators, size and number of FM-PMTs attached on the counter module,
and geometry of the counter module box. The light yield ranges from
10 to 20 for the barrel ACC and from 25 to 30 for the end-cap ACC, high
enough to provide useful
  separation.
Figure:
Average number of photoelectrons  for (a) each
counter row in barrel ACC and (b) each layer in end-cap ACC.
 |


Next: Particle Identification of Electrons
Up: Aerogel Cerenkov Counter System,
Previous: Monte Carlo simulation
Contents
Samo Stanic
2001-06-02


