

Next: Time-of-Flight Counters, TOF
Up: Particle Identification of Electrons
Previous: EID and fake rate
Contents
The  identification is carried out by combining information
from three nearly-independent measurements:
 measurement by the CDC,
- TOF measurement, and
- measurement of the number of photoelectrons (
 ) in the ACC.
As in the case of EID, the likelihood function for each measurement
was calculated and the product of the three likelihood functions
yields the overall likelihood probability for being a kaon or a pion,
 or
or  .
A particle is then identified as a kaon or a pion by cutting on the
likelihood ratio (
 ):
):
 |
(1) |
 |
(2) |
The validity of the  identification has been demonstrated using
the charm decay,
 , followed by
 . The characteristic slow
  from the
 decay allows these decays to be selected with a good
 ratio (better than 30), without relying on particle
identification. Therefore, the detector performance can be directly
probed with the daughter
  and
and  mesons from the
  decay,
which can be tagged by their relative charge with respect to the slow
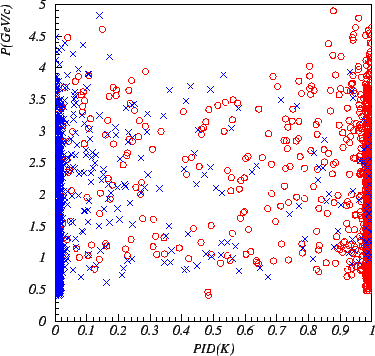
pion. Fig.
 ![[*]](./icons/crossref.png) shows two dimensional plots of the
likelihood ratio
shows two dimensional plots of the
likelihood ratio  and measured momenta for the kaon and pion
tracks. The figure demonstrates the clear separation of kaons and
pions up to around 4GeV/
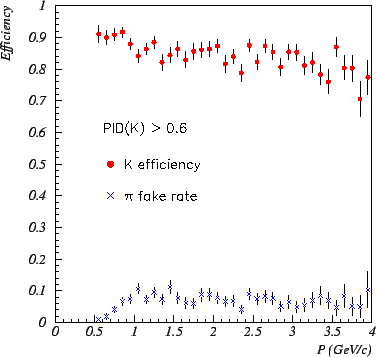
 . The measured
  efficiency and
  fake rate in the barrel region are plotted as functions of the track
momentum from 0.5 to 4.0 GeV/
 in Fig.
 ![[*]](./icons/crossref.png) .
The likelihood ratio cut,
.
The likelihood ratio cut,
 , is applied in this
figure. For most of the region, the measured
  efficiency exceeds
80%, while the
  fake rate is kept below 10%.
Figure:
Likelihood ratio  , versus momenta for daughter
tracks from
 decays, tagged by the
charge of the slow
  's.
The open circles correspond to kaons and the cross points to pions.
 |
Figure:
 efficiency and
  fake rate, measured with
 decays,
for the barrel region.
The likelihood ratio cut
 is applied.
 |


Next: Time-of-Flight Counters, TOF
Up: Particle Identification of Electrons
Previous: EID and fake rate
Contents
Samo Stanic
2001-06-02


