

Next: Photon beams at the
Up: Beam Tests
Previous: Beam Tests
Contents
The performance test of a prototype of the Belle ECL detectors was
carried out using the  2 beam line at KEK in an energy range from
0.25 to 3.5 GeV [59]. An array of 6
  5
CsI(
 ) counters with the same mechanical assembly and readout
electronics as those of Belle ECL were used to measure the energy and
position resolution for electrons and the e/
 separation for two
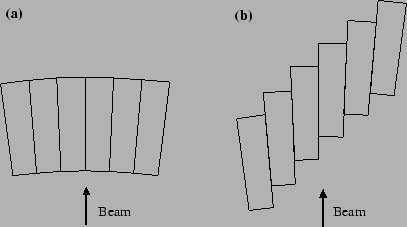
sets of matrix configurations: one corresponded to the center and the
other to the edge of the barrel calorimeter.
Fig.
 ![[*]](./icons/crossref.png) shows the schematic top view of the two matrix configurations. The
whole matrix was placed on a movable table controlled by an online
computer.
shows the schematic top view of the two matrix configurations. The
whole matrix was placed on a movable table controlled by an online
computer.
Figure:
Top view of two matrix configurations: (a) normal array and
(b) staggered array.
 |
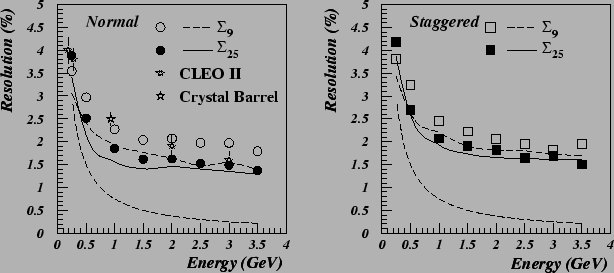
The energy resolution was measured by using electrons which impinged
 2 cm from the center of the matrix by summing the energy deposit
weighted by the calibration constant of each crystal. The summation
was carried out for a 3
  3 matrix (9 crystals) and a 5
 5 matrix (25 crystals). The total energy deposit was then
scaled event by event by the momentum measured by the spectrometer in
order to compensate for the spread of beam momentum. The energy
resolution measured for the two matrix arrangements (normal and
staggered) is shown in
Fig.
 ![[*]](./icons/crossref.png) as a function of beam momentum together
with the measurements of CLEO II [65] and Crystal
Barrel [66]. A Monte Carlo simulation using GEANT
3.15 reproduced the general behavior of the energy resolution but
tended to predict a slightly better overall resolution. This may be
explained by the nonuniformity of the light collection in the crystal,
which was not included in the simulation.
as a function of beam momentum together
with the measurements of CLEO II [65] and Crystal
Barrel [66]. A Monte Carlo simulation using GEANT
3.15 reproduced the general behavior of the energy resolution but
tended to predict a slightly better overall resolution. This may be
explained by the nonuniformity of the light collection in the crystal,
which was not included in the simulation.
Figure:
Energy resolution as a function of beam energy. Results from
a GEANT simulation are shown by the dashed curve (9 blocks) and the
solid curve (25 blocks). Also plotted are the results of CLEO II (9
blocks) and Crystal Barrel. The dotted curve shows the contribution
from electronics noise for 25 blocks.
 |
The impact point of an electron on the matrix was calculated from the
position of each crystal summed with the weight of its energy deposit.
Position resolutions were determined from the correlation between the
impact position and the position obtained by the drift chamber system
to be 3.6 mm for 2.0 GeV/c electrons and 5.8 mm for 0.5 GeV/c
electrons.
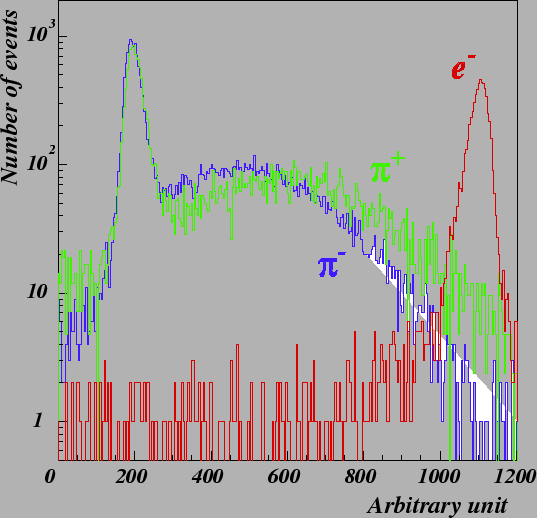
The difference of the energy deposit in the calorimeter can be used to
distinguish electrons from charged pions.
Fig. ![[*]](./icons/crossref.png) shows the energy deposit summed over 25 crystals for 1 GeV/c electrons
and pions injected near to the center of the matrix. We see a
difference in the spectra for
shows the energy deposit summed over 25 crystals for 1 GeV/c electrons
and pions injected near to the center of the matrix. We see a
difference in the spectra for  and
and  due to the
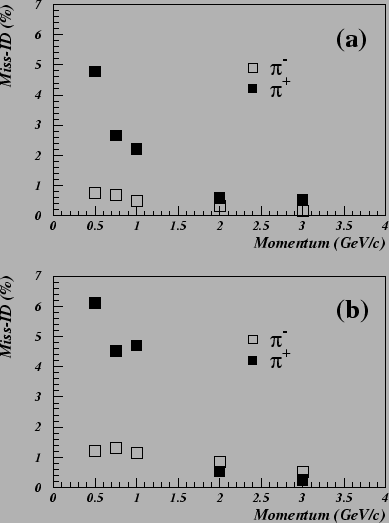
difference in cross sections. We define the probability for a pion to
be misidentified as an electron by
 , where
  is the number of pion events with an energy deposit in the electron
energy region and
  is the total number of pion events. The
electron region is defined as
 around the peak of the
electron energy deposit, where
  is the energy resolution of
the electrons. The results of an e/
 separation for positive and
negative pions are shown in
Fig.
 ![[*]](./icons/crossref.png) for energies of 0.5
for energies of 0.5 3 GeV and for the normal and staggered arrays.
The misidentification probability is found to be less than 1 % above
2 GeV/c.
Figure:
Distribution of the energy deposit by electrons (red
histogram), by positive pions (green histogram) and by negative pions
(blue histogram) at 1 GeV/c.
 |
Figure:
Probability to misidentify a pion as an electron (a) for the
normal array and (b) for the staggered array.
 |


Next: Photon beams at the
Up: Beam Tests
Previous: Beam Tests
Contents
Samo Stanic
2001-06-02


