


Next: Performance
Up: Beam Tests
Previous: 2 beam
Contents
Extensive tests of a prototype of the Belle ECL calorimeter were
carried out using photon beams produced at the ROKK-1M facility of
BINP in the photon energy range from 20 MeV to 5.4 GeV.
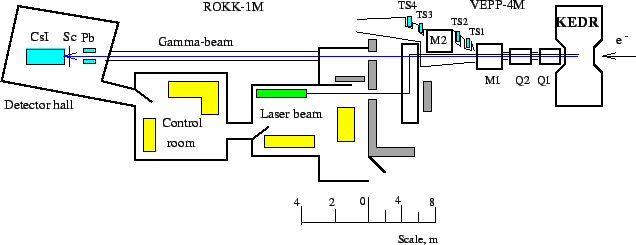
Fig. ![[*]](./icons/crossref.png) shows the layout of the ROKK-1M facility. The beam of backward
scattered photons was used in the photon energy range below 850 MeV.
The photon energy was determined by measuring the scattered electron
energy by the tagging system, the energy resolution of which was
shows the layout of the ROKK-1M facility. The beam of backward
scattered photons was used in the photon energy range below 850 MeV.
The photon energy was determined by measuring the scattered electron
energy by the tagging system, the energy resolution of which was
 . The second harmonic of a (Nd:YAG) pulse
laser corresponds to the photon energy of 2.34 eV. The Compton photon
(CP) energy spectrum is roughly uniform with a sharp edge at the
maximum CP energy,
 , where
  is the energy of the laser photon and
 is the electron mass. The photon energy resolution was kept
less than 1 % for a wide range of photon energies by optimizing the
electron beam energies. The main background process for Compton
photons is the beam electron bremsstrahlung at the residual gas
nuclei. As will be described later, bremsstrahlung photons were used
to obtain the energy resolution for high energy photons.
Figure:
Layout of the VEPP-4M experimental region with the KEDR
tagging system.  and
and  are quadrupoles, and
  and
and  are bending magnets.
 |
The experimental setup is shown in
Fig. ![[*]](./icons/crossref.png) The prototype consists of a 6
The prototype consists of a 6  6 matrix of the CsI(
 )
counters with the same characteristics as those of the Belle ECL
counters. The support frame of the counters allowed to move the
prototype within
  10 cm in the vertical and horizontal directions
as well as to adjust the angle of the prototype to the photon beam
within
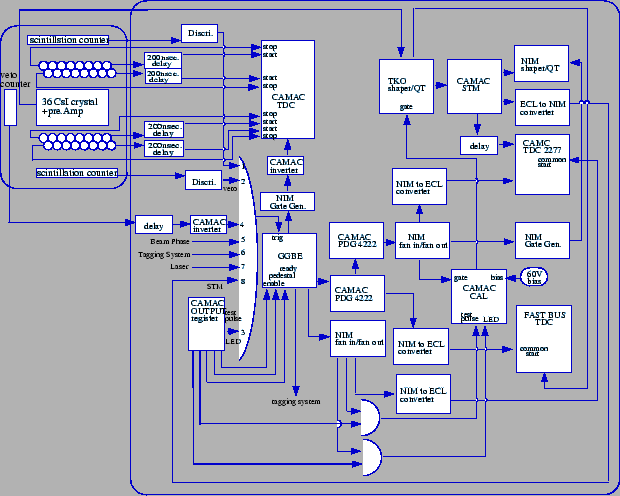
  0.2 rad. The layout of the readout system used in the
tests is shown in
Fig.
 ![[*]](./icons/crossref.png) .
The trigger signal was produced by coincidence of the laser pulse, a
signal from the tagging system, and the beam crossing phase in the
absence of the signal from the veto counter.
.
The trigger signal was produced by coincidence of the laser pulse, a
signal from the tagging system, and the beam crossing phase in the
absence of the signal from the veto counter.
Figure:
Experimental layout. CsI(Tl) crystals are represented by 1,
drift-tube hodoscopes by 2, plastic scintillation counters for cosmic
trigger by 3, a lead collimator by 4, a veto counter by 5, and a
movable platform for the position adjustment by 6.
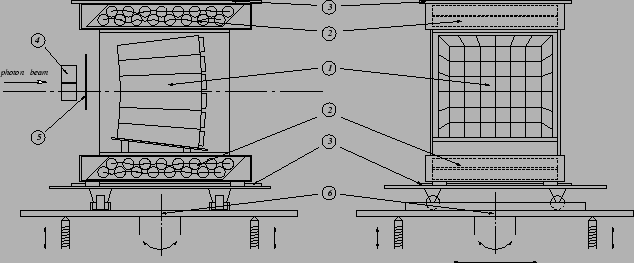 |
Figure:
Schematic diagram of the beam test experiment.
 |
The energy deposition in a crystal is calculated as
 , where
  is the energy deposition in the
  th crystal,
  is the corresponding ADC channel, and
  is the calibration
coefficient. One of the simple ways of calibration is to use cosmic
rays, as described in the section of the calibration by cosmic rays.
The average energy deposition in the crystal is proportional to the
track length within the crystal volume which depends both on the
particle angle and coordinate along the crystal. For a minimum
ionizing particle the average energy deposition per unit length in CsI
is 5.67 MeV/cm that provides about 30-40 MeV energy deposition in each
counter.
The tracks of cosmic muons were reconstructed by the hodoscopes of the
muon streamer tubes. The hodoscope position resolution of 15 mm is
sufficient to measure the track length inside the crystal with an
accuracy better than 1.5 % when a particle crosses two opposite side
surfaces. The calibration by cosmic rays was performed regularly
between beam-test runs.
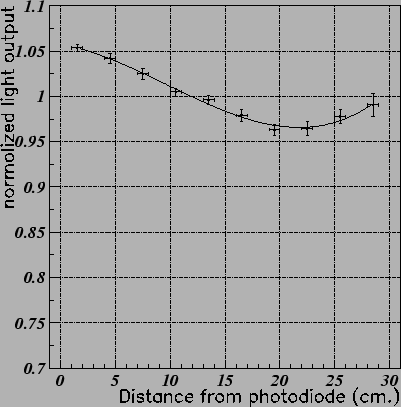
Fig. ![[*]](./icons/crossref.png) shows the longitudinal nonuniformity of light collection of a typical
counter. The mean nonuniformity in the longitudinal direction for all
the crystals used in the tests was about 7 %.
shows the longitudinal nonuniformity of light collection of a typical
counter. The mean nonuniformity in the longitudinal direction for all
the crystals used in the tests was about 7 %.
Figure:
Longitudinal non-uniformity of light collection of the crystal.
 |
As the electronics noise is the crucial point for the calorimeter
resolution at low energies, this characteristic was carefully studied.
The noise value was estimated by a pedestal distribution width both
for a single channel and for the sum of a few channels. By fitting
the pedestal distributions, the noise contributions from a single
channel ( ) and the sum of
  channels (
 ) were
determined. The coherent and incoherent noise components are
separated using the following equations:
 |
(7) |
 |
(8) |
 |
(9) |
 |
(10) |
where
 and
and
 stand for the incoherent
and coherent noise components of the
  th channel, respectively.
The total incoherent and coherent noise components were determined to
be 189-250 keV and 17-50 keV, respectively. It was found that the
dominant part of the coherent noise came from the ADC itself. The
latest measurement of the coherent noise of 17 keV gives a
substantially improved noise level. These results are very
satisfactory.
For reconstruction of the photon energy the energy deposition in the 3
 3 (
3 ( ) and the 5
  5 (
5 ( ) matrix around the
crystal with the maximum energy was used. Using the energy measured
by the tagging system
  as a photon energy
  , the
energy resolution dependence on the photon energy was studied for each
beam energy from the low limit determined by the tagging system
acceptance up to the Compton edge. Distributions of the ratio
 or
or
 have an asymmetric shape which
was fitted by the normal logarithmic function written as
where is the deposited energy, is the energy
corresponding to the peak position, is a parameter describing
the asymmetry of the distribution, and N is the normalization factor.
The energy resolution is defined by the full width at half
maximum of the distribution as
and is expressed via
The energy resolution of the CsI was obtained by the relation
Since the tagging system resolution
is better than 1 % for 100 MeV, the effect of the
subtraction is small.
Another possibility to measure the CsI energy resolution is the
analysis of the edge of the Compton photon spectrum detected by the
CsI matrix. This method does not use information from the tagging
system and provides an independent check of the results. The CsI
energy distribution is fitted by the convolution of the function of
Eq.(![[*]](./icons/crossref.png) ) and Compton distribution approximated by
) and Compton distribution approximated by
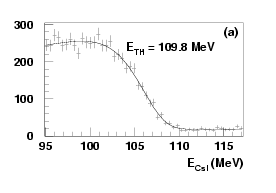
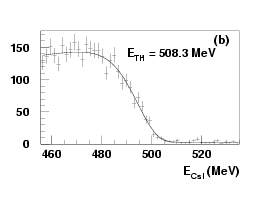
where is the Compton spectrum edge. Examples of the fit are
shown in
Fig. ![[*]](./icons/crossref.png) .
.
Figure:
Typical Compton-edge distributions at (a) 109.8 MeV and (b)
508.3 MeV. The solid curves are the fitted results.
|
|
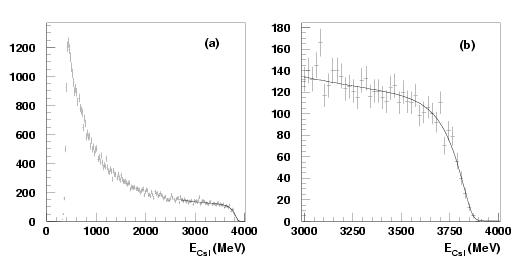
In the latest measurement [64] the bremsstrahlung edge
was also used to determine the energy resolution at higher energies.
The same procedure was used as for the Compton edge analysis. A
typical distribution is shown in
Fig. ![[*]](./icons/crossref.png) .
.
Figure:
(a) Typical bremsstrahlung energy distribution for a 4036 MeV
electron beam and (b) an expanded view of the edge region with the
fitted curve.
|
The energy resolution was obtained for the 3  3 and 5
  5 CsI matrices in two ways: the total energy sum was used in the first
method and the energy sum from the counters above a certain threshold
energy in each matrix was used in the second method.
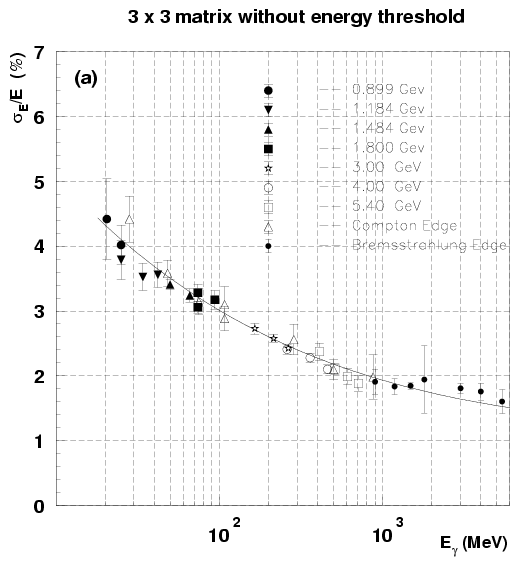
Fig.
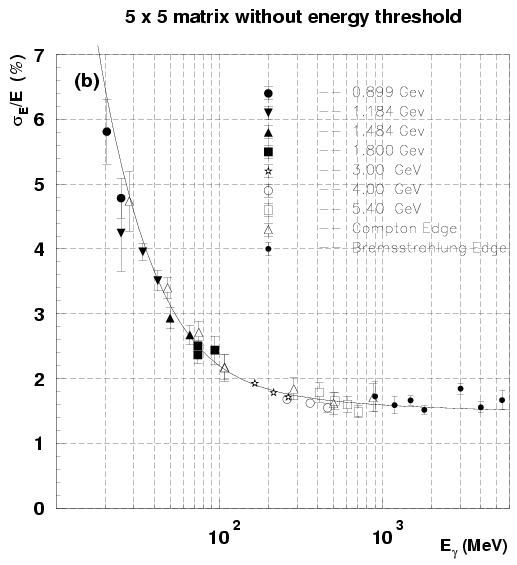
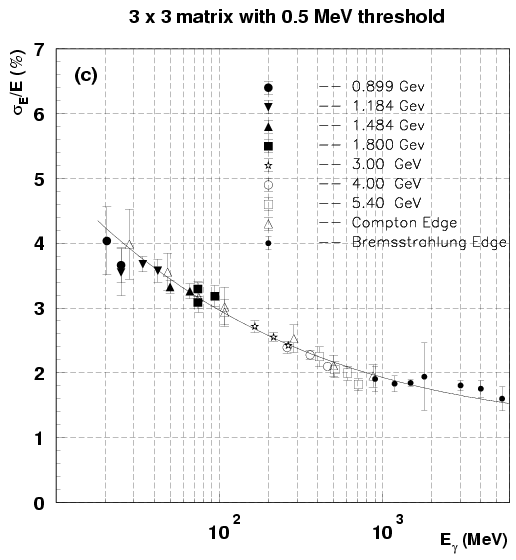
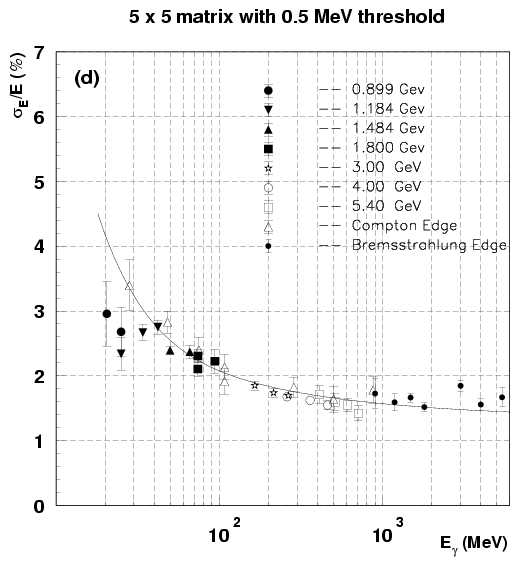
 ![[*]](./icons/crossref.png) shows the results of the
analysis. Figures (c) and (d) correspond to the energy resolution for
the threshold energy of 0.5 MeV. The energy resolution without
threshold for the 5
shows the results of the
analysis. Figures (c) and (d) correspond to the energy resolution for
the threshold energy of 0.5 MeV. The energy resolution without
threshold for the 5  5 matrix is substantially better at
higher energies, above 100 MeV, than that for the 3
  3 matrix
because of better energy containment, while it is appreciably poorer
at lower energies, below 30 MeV, due to large contribution of summed
electronics noise. This situation in the low energy region has been
improved by applying an optimum threshold energy.
Fig.
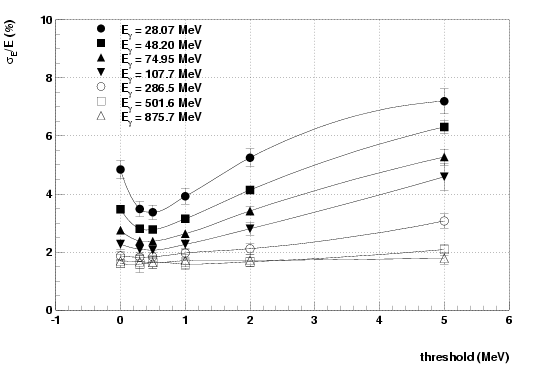
 ![[*]](./icons/crossref.png) shows the energy resolution as a function
of threshold energy at various photon energies. At photon energies
below 100 MeV the threshold energy above 2 MeV degrades the energy
resolution. On the other hand, the energy resolution is very
insensitive to the threshold energy at photon energies above 300 MeV.
In the photon energy range of interest the threshold energy of 0.5 MeV
seems to be optimum. The resolutions obtained by the three methods are
consistent over the energy range from 20 MeV to 5.4 GeV.
shows the energy resolution as a function
of threshold energy at various photon energies. At photon energies
below 100 MeV the threshold energy above 2 MeV degrades the energy
resolution. On the other hand, the energy resolution is very
insensitive to the threshold energy at photon energies above 300 MeV.
In the photon energy range of interest the threshold energy of 0.5 MeV
seems to be optimum. The resolutions obtained by the three methods are
consistent over the energy range from 20 MeV to 5.4 GeV.
Figure:
Energy resolution as a function of incident photon energy for
the (a) 3  3 and (b) 5
  5 matrices with the total
energy sum, and for the (c) 3
  3 and (d) 5
  5 matrices
with a 0.5 MeV threshold. The error bars are the rms values of four
measurements taken with the crystals (3, 3), (3, 4), (4, 3) and (4,4)
into the photon beam.
|
|
|
|
Figure:
Energy threshold dependence of the energy resolution at various photon energies.
|
The energy resolution obtained with the threshold energy of 0.5 MeV
(Figs. ![[*]](./icons/crossref.png) (c) and (d)) can be fitted by the
quadratic sum () of three terms as follows:
(c) and (d)) can be fitted by the
quadratic sum () of three terms as follows:
for the 3  3 matrix sum, and
for the 5  5 matrix sum, E in GeV. Since details of the fitted
results are not completely identical, we quote the latest results.
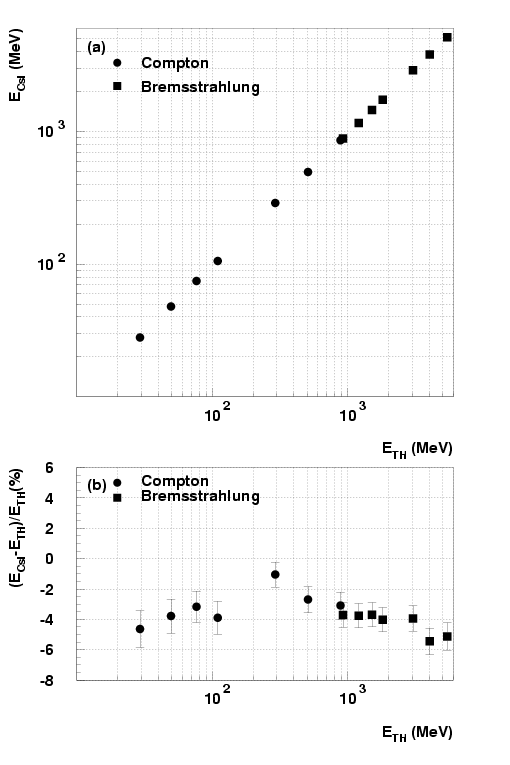
The linearity of the energy response was studied in the energy range
from 20 MeV to 5.4 GeV by fitting the edge of the Compton and
bresstrahlung spectra. The correlation between obtained by
fitting the data and the theoretical edge value () calculated
from the electron beam energy is plotted in
Fig. ![[*]](./icons/crossref.png) (a). The value of was obtained
from the energy sum of the 5
(a). The value of was obtained
from the energy sum of the 5  5 matrix with a threshold energy
of 0.5 MeV. The linearity defined as
is
plotted in
Fig.
 ![[*]](./icons/crossref.png) (b). For all energy ranges, is
smaller than because of shower leakage from the central 5
(b). For all energy ranges, is
smaller than because of shower leakage from the central 5
 5 counters. At higher energies the leakage from the rear end
of the crystal becomes dominant. The major part of the error bars
comes from the rms deviation of the four measurements, for which the
photon beam was injected at different crystals.The total uncertainty
including the electronics nonlinearity was estimated to be
approximately
  1 %. We conclude that the energy deposit in the
5
  5 matrix with a 0.5 MeV threshold reproduced the absolute
photon beam energy within
  3
3  2 % in a broad energy range from
20 MeV to 5.4 GeV. A GEANT simulation could reproduce the
experimental data well within
  1 %, except for a small
systematic shift of
  2 % below 100 MeV.
Figure:
(a) The incident photon energy versus the measured energy in
CsI from data, and (b) the energy linearity obtained from the data.
|
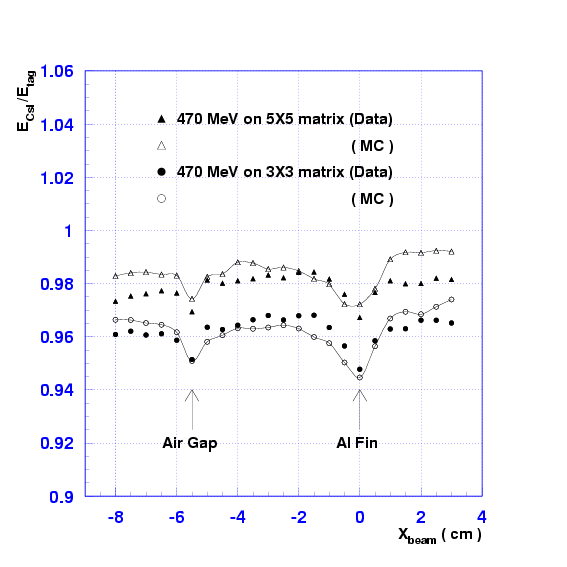
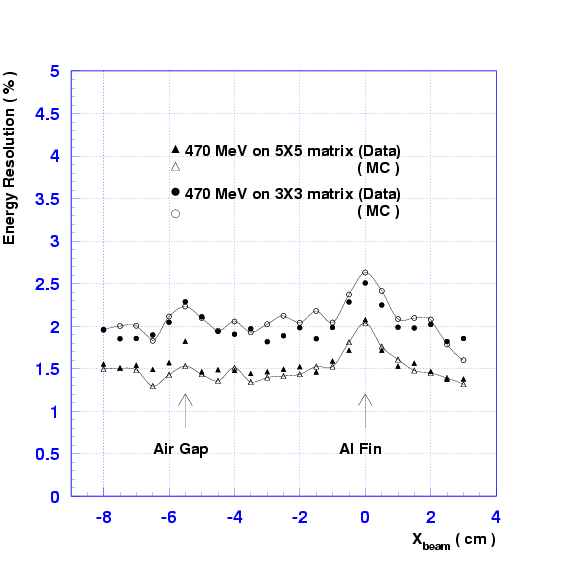
A narrow photon beam of rectangular shape (4 mm  4 mm) was
used to study the position dependence of energy deposition and energy
resolution.
Figs.
 ![[*]](./icons/crossref.png) and
and ![[*]](./icons/crossref.png) show the
measured position dependence of the energy deposit and energy
resolution as a function of lateral horizontal position. The Compton
photon beam in the energy range of
MeV was
used. Small decreases in energy and degradations in energy resolution
were measured at the air gap and the aluminum fin (0.5 mm thick). The
GEANT Monte Carlo simulation reproduced the behavior of the data quite
well.
show the
measured position dependence of the energy deposit and energy
resolution as a function of lateral horizontal position. The Compton
photon beam in the energy range of
MeV was
used. Small decreases in energy and degradations in energy resolution
were measured at the air gap and the aluminum fin (0.5 mm thick). The
GEANT Monte Carlo simulation reproduced the behavior of the data quite
well.
Figure:
Position dependence of the energy deposit. The solid
triangles and circles are the results obtained by a GEANT Monte Carlo
simulation.
|
Figure:
Position dependence of the energy resolution. The open
triangles and circles are the results obtained by a GEANT Monte Carlo
simulation.
|
The position resolution was measured by moving the prototype in the
transverse direction along the horizontal plane. First the shower
center of gravity () was calculated using the relation
where is the  (or
(or  )-coordinate of the center of the
  th
counter and
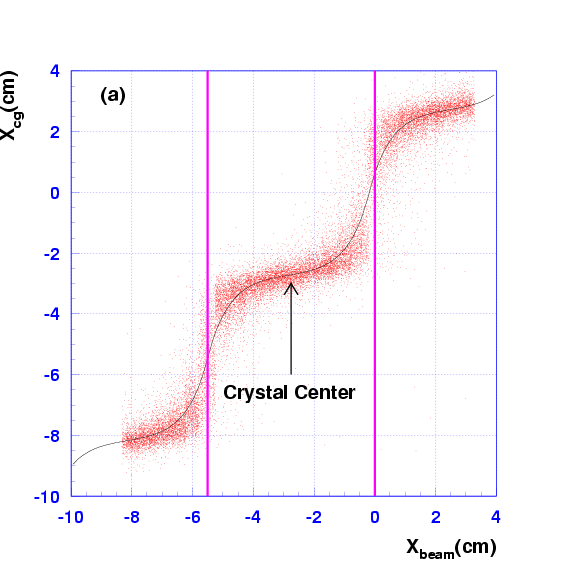
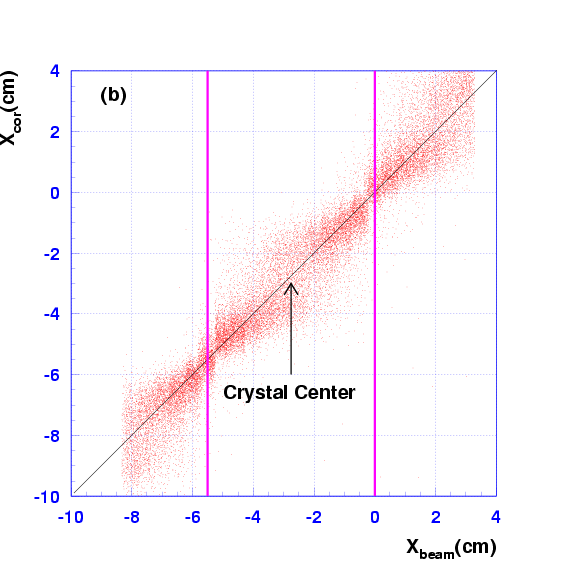
  is its energy deposit. A scatter plot of the average
versus the photon impact coordinate () is shown
in
Fig.
 ![[*]](./icons/crossref.png) (a). The position is smeared
uniformly within the aperture of the collimator. The center of
gravity gives the correct position at the center of the crystal and at
the gap between two crystals, but shows systematic shifts at the other
positions. In order to correct the systematic effect an empirical
function was used to get the correlation between and
and to calculate the corrected position .
Fig.
(a). The position is smeared
uniformly within the aperture of the collimator. The center of
gravity gives the correct position at the center of the crystal and at
the gap between two crystals, but shows systematic shifts at the other
positions. In order to correct the systematic effect an empirical
function was used to get the correlation between and
and to calculate the corrected position .
Fig. ![[*]](./icons/crossref.png) (b) shows a scatter plot of versus
. The systematic shift seen in Fig.
(b) shows a scatter plot of versus
. The systematic shift seen in Fig. ![[*]](./icons/crossref.png) (a) is
almost removed. The residual distribution (
)
corresponds to the average resolution of the corrected beam-impact
position.
(a) is
almost removed. The residual distribution (
)
corresponds to the average resolution of the corrected beam-impact
position.
Figure:
Scatter plots of and (a) before and (b)
after a correction. The gap between the crystals is shown by the
thick vertical lines. The solid curve in (a) is the fit to an
empirical formula.
|
|
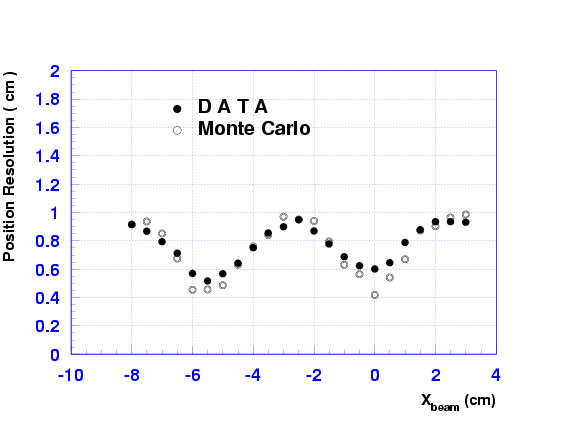
Figure ![[*]](./icons/crossref.png) shows the position dependence of the
spatial resolution for 470 MeV photons. The solid and open circles
correspond to the experimental data and Monte Carlo results,
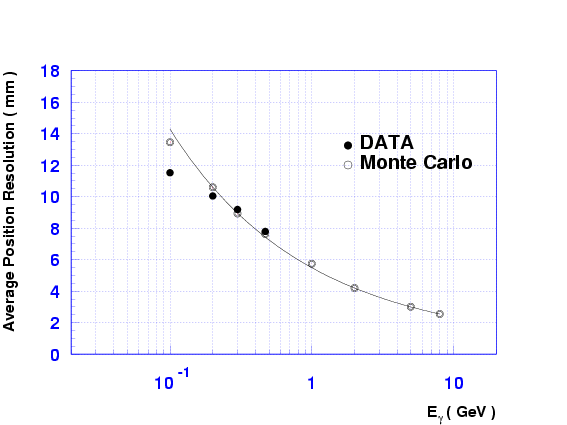
respectively. The energy dependence of the average position
resolution is shown in
Fig.
shows the position dependence of the
spatial resolution for 470 MeV photons. The solid and open circles
correspond to the experimental data and Monte Carlo results,
respectively. The energy dependence of the average position
resolution is shown in
Fig. ![[*]](./icons/crossref.png) as a function of photon energy. The
points above 1 GeV are Monte Carlo data. The solid curve is fitted by
the relation
as a function of photon energy. The
points above 1 GeV are Monte Carlo data. The solid curve is fitted by
the relation
where is measured in units of GeV.
The present results of the energy and spatial resolutions measured by
the photon beams for the Belle ECL prototype counters are in
reasonable agreement with those measured using the electron beam at
KEK in the energy range above 1 GeV [59].
Figure:
Position dependence of the spatial resolution for 470 MeV photons.
|
Figure:
Energy dependence of the average position resolution. The
solid curve is a fit to Eq. ![[*]](./icons/crossref.png) .
.
|


Next: Performance
Up: Beam Tests
Previous: 2 beam
Contents
Samo Stanic
2001-06-02


