

Next: Performance
Up: and Muon Detection System,
Previous: Readout Electronics
Contents
The relatively high resistance of the glass [75],  5 x
5 x  cm, limits the rate capability of these
counters to
  0.2 Hz/cm
 . However, in the present application
in which the particle flux is little more than the cosmic ray flux,
the detectors function with high efficiency. Signals typically have a
100 mV peak into a 50
  termination and have a full width at
half maximum of less than 50 ns. A typical RPC has a singles rate of
less than 0.03 Hz/cm
 with few spurious discharges or
after-pulses. We operate the barrel (end-cap) modules at 4.3 (4.2)
kV/mm with a signal threshold of 40 (70) mV. The choice of different
operating points is due to the differences in the characteristics of
the pickup strips for the barrel and end-cap modules.
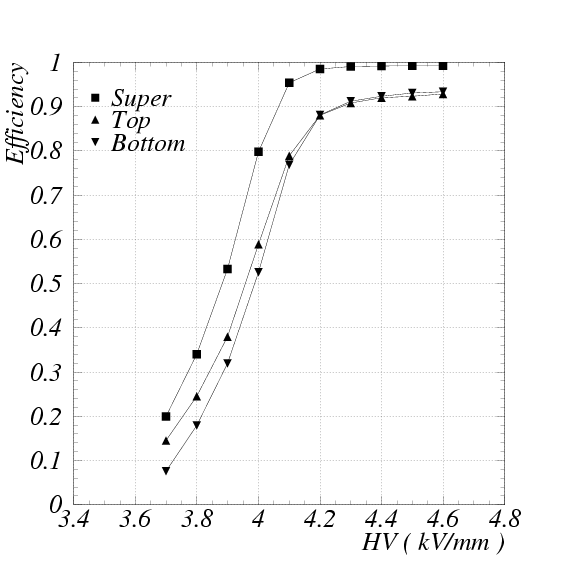
Figure ![[*]](./icons/crossref.png) shows efficiency versus voltage curves
for individual RPC layers alone and in combination in a typical
super-layer in the end-cap. These data were obtained using cosmic rays.
The efficiency was obtained by tracing a particle using other
super-layers. The predicted location of the track was searched within
shows efficiency versus voltage curves
for individual RPC layers alone and in combination in a typical
super-layer in the end-cap. These data were obtained using cosmic rays.
The efficiency was obtained by tracing a particle using other
super-layers. The predicted location of the track was searched within
 1 strip. Although the area near the internal spacers is
inactive, care was taken to ensure that the internal spacers do not
overlap. Under the normal operating condition, the super-layer acts as
a logical "OR" for hits in either RPC layer and has an average
efficiency typically over 98 %.
Figure:
Efficiency plateau curves for RPCs alone and in combination
in a typical super-layer of KLM.

|
Cosmic rays were used to map the efficiency and to determine the
relative positions of all the super-layer modules. In addition, the
response of the modules to penetrating muons was measured and the
results were used as input to the simulation programs. For example,
for a given set of operating voltage and discriminator threshold, a
penetrating muon generates the average hits of 1.4 strips and 1.9
strips per layer in the barrel and end-cap modules, respectively.
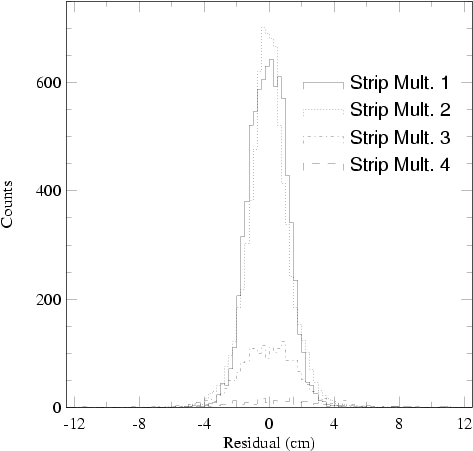
The spatial resolution of the modules is shown in
Fig. ![[*]](./icons/crossref.png) . This residual distribution is the
difference between the measured and predicted hit locations using a
track that has been fitted using hits in the adjacent layers. The
multiplicity referred to is the number of strips in the super-layer
that have signals over threshold. When two or more adjacent strips
have signals over threshold, the hit location used for particle
tracking is calculated by averaging the strips together. For hits
with 1, 2, 3, and 4 strips, the standard deviations are 1.1, 1.1, 1.7,
and 2.9 cm, respectively. The multiplicity weighted standard
deviation for this residual distribution is 1.2 cm and gives angular
resolution from the interaction point of better than 10 mrad. TDCs
provide time information for the hits that can be used to eliminate
hits which are out of time with respect to the
. This residual distribution is the
difference between the measured and predicted hit locations using a
track that has been fitted using hits in the adjacent layers. The
multiplicity referred to is the number of strips in the super-layer
that have signals over threshold. When two or more adjacent strips
have signals over threshold, the hit location used for particle
tracking is calculated by averaging the strips together. For hits
with 1, 2, 3, and 4 strips, the standard deviations are 1.1, 1.1, 1.7,
and 2.9 cm, respectively. The multiplicity weighted standard
deviation for this residual distribution is 1.2 cm and gives angular
resolution from the interaction point of better than 10 mrad. TDCs
provide time information for the hits that can be used to eliminate
hits which are out of time with respect to the  collision.
The time resolution of KLM is a few ns.
Figure:
Spatial resolution of a super-layer of KLM

|


Next: Performance
Up: and Muon Detection System,
Previous: Readout Electronics
Contents
Samo Stanic
2001-06-02

