 |
 |
||||||||||
EXTENDED X-RAY ABSORPTION FINE STRUCTURE
Published
in:
1)
A. Kodre, I.
Arčon, Proceedings of 36th International Conference on Microelectronics,
Devices and Materials, MIDEM, Postojna, Slovenia, October 28-20, 2000,
p. 191-196
2) I. Arčon, M. Mozetič, A. Kodre, J. Jagielski, A.
Traverse, EXAFS study of NiAl in thin films, J. Sinch. Radiation 8 (2001)
493-495
Abstract
With the availability of the synchrotron radiation sources, x-ray absorption
spectroscopy techniques (XAS) developed into widely used tools for the
structural research of materials by identifying the local structure
around atoms of a selected type in the sample. In EXAFS (Extended X-ray
Absorption Fine Structure) number and species of neighbour atoms, their
distance from the selected atom and the thermal or structural disorder
of their positions can be determined from the oscillatory part of the
absorption coefficient above a major absorption edge. The analysis can
be applied to crystalline, nanostructural or amorphous materials, liquids
and molecular gases. EXAFS is often the only practical way to study
the arrangement of atoms in materials without long range order, where
traditional diffraction techniques cannot be used.
Introduction
High resolution x-ray
absorption spectroscopy (XAS), that became available with the development
of synchrotron radiation sources, has introduced powerful experimental
methods for the investigation of atomic and molecular structures of
materials. With the synchrotron radiation high-flux monochromatic x-ray
beams with the energy resolution ![]() of the order of 10^(-4) are easily obtainable, allowing measurements
of high quality absorption spectra in a short time. In a typical experimental
set-up (Fig. 1) ionisation cells monitor the intensity of incident (Io)
and transmitted (I1) monochromatic photon beam through the sample. With
the well-known exponential attenuation of x-rays in a homogeneous medium,
the absorption coefficient
of the order of 10^(-4) are easily obtainable, allowing measurements
of high quality absorption spectra in a short time. In a typical experimental
set-up (Fig. 1) ionisation cells monitor the intensity of incident (Io)
and transmitted (I1) monochromatic photon beam through the sample. With
the well-known exponential attenuation of x-rays in a homogeneous medium,
the absorption coefficient ![]() at
a given photon energy E can be obtained from the relation
at
a given photon energy E can be obtained from the relation ![]() ,
where d is the sample thickness. The energy dependence of the absorption
coefficient is collected by a stepwise scan of the photon energy in
the monochromatic beam with the Bragg monochromator.
,
where d is the sample thickness. The energy dependence of the absorption
coefficient is collected by a stepwise scan of the photon energy in
the monochromatic beam with the Bragg monochromator.
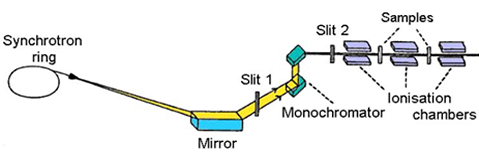 |
| Fig. 1. Schematic view of E4 x-ray beamline at Hamburger Synchrotron Radiation Laboratory (HASYLAB) at DESY in Hamburg. |
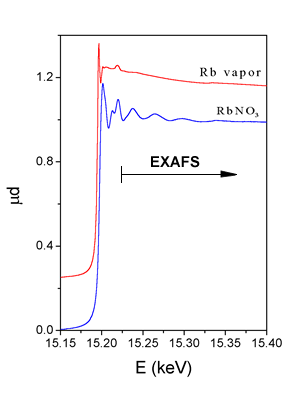 |
The dominant process in the x-ray absorption at photon energies below 100 keV is photoeffect, whereby the photon is completely absorbed, transferring its energy to the ejected photoelectron. The x-ray absorption coefficient for photoeffect decreases smoothly with increasing photon energy. However, when the photon energy reaches one of the deep inner-shell ionization energies of the atom, a sharp jump (absorption edge) marks the opening of an additional photoabsorption channel. Immediately above the absorption edge, in a range of up to 1000 eV, a precise measurement of absorption shows rich fine structure superposed onto the smooth energy dependence. The structure is called Extended X-ray Absorption Fine Structure (EXAFS). An example is shown in Fig. 2, where K-edge absorption spectrum of rubidium measured on RbNO3 in water solution, is plotted. EXAFS appears above the absorption edges whenever the absorbing atom is closely surrounded by other atoms i.e. in solid state, in liquids or in molecular gasses. In case of free atoms, as for example in noble gasses or monatomic vapours (Rb vapour spectrum in Fig. 2), there is no EXAFS component in the absorption spectrum. |
|
| Fig. 2 : X-ray absorption spectra of RbNO3 water solution and rubidium vapour in the energy range of Rb K-edge. |
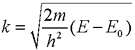
EXAFS arises from
the wavelike nature of the final photoelectron state. When an x-ray
photon is absorbed an inner shell electron is preferentially ejected
as a photoelectron with kinetic energy equal to the difference between
the photon energy E and the inner-shell binding energy Eo. According
to quantum theory this photoelectron can be visualized as an outgoing
spherical wave centred at the excited atom (Figure 3). The photoelectron
wavevector is ![]() given by:
given by:
 |
(1) |
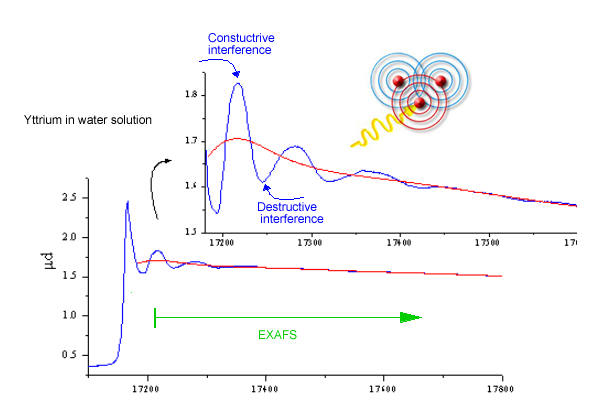
This electron wave is scattered by neighbor atoms, and the new waves emanating from each scattering site are superposed to the initial outgoing wave. The interference of the initial and scattered waves at the absorbing atom affects the probability for photoeffect. With the increasing (x-ray) photon energy the wavevector of the photoelectron wave increases, leading to alternating constructive and destructive interference.
 |
|
Fig.
3. Schematics of the EXAFS process illustrating the
origin of EXAFS oscillations due to the interference of outgoing
and backscattered photoelectron wave. |
The oscillatory part of the absorption coefficient is normalised by the smooth atomic absorption background ?o, defining the EXAFS signal:
| (2) |
If we consider only the contribution of single scattering from the surrounding
atoms then the EXAFS signal can be completely described by a sum of
sine terms in the wavevector k. Each term represents a contribution
of a spherical shell of equivalent atoms at a distance Ri from the absorbing
atom [1]:
| (3) |
with the atom-specific phase shift di and the amplitude factor:
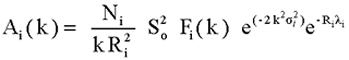 |
(4) |
where Ni is the number of atoms in the shell, Fi(k) the corresponding
magnitude of the photoelectron backscattering amplitude, ![]() Debye-Waller factor, measuring the thermal and structural disorder in
the shell, and
Debye-Waller factor, measuring the thermal and structural disorder in
the shell, and ![]() is the mean free path of the photoelectron. Additional amplitude reduction
factor
is the mean free path of the photoelectron. Additional amplitude reduction
factor ![]() is introduced to describe effects of multielectron excitations accompanying
the photoeffect in the inner shell.
is introduced to describe effects of multielectron excitations accompanying
the photoeffect in the inner shell.
We can see that EXAFS spectrum measured above the absorption edge of
a selected type of atoms contains scalar information on their local
structure. One could say that a photoelectron emitted in the process
of photoeffect acts as a radar wave sensing the immediate vicinity of
the parent atom and the information is stored in the resulting EXAFS
oscillations.
By Fourier transformation of the measured EXAFS structure the contributions
of individual shells of atoms are separated visually. The peaks in FT
magnitude spectra appear at the corresponding positions Ri. To obtain
quantitative information on the local environment, i.e. number and species
of neighboring atoms in a given shell, their distance from the absorbing
atom and their thermal or structural disorder, the peak of interest
is analysed. An example is given in Figs. 4 and 5, where Ni K-edge EXAFS
spectra measured on Ni metal and several Ni/Al nanostructure coatings
are shown together with their Fourier transform magnitudes.
The theoretical basis of the EXAFS method is firmly established and
the necessary electron scattering data known with sufficient accuracy
so that ab initio modeling of the structure is possible. Several computer
programs have been developed for the quantitative analysis, which take
into account single scattering (eq. 3,4) as well as multiple scattering
contributions to the EXAFS signal [2,3]. Structural parameters are obtained
by fitting of the model function to the measured EXAFS spectra in real
(k) or in Fourier transform (R) space. Interatomic distance can be determined
with very high accuracy (typical uncertainties below 1%), while for
the number of neighbors and the corresponding Debye-Waller factor lower
precision (~ 10%) is only attainable, due to correlations between the
two parameters.
This structural
information can be extracted not only for crystalline materials, but
most notably also for amorphous materials, liquids and molecular gases,
where traditional diffraction techniques cannot be used. For materials
without long range order, EXAFS is often the only practical way to study
the arrangement of atoms.
In the example in Figs. 4 and 5 Ni K edge EXAFS is used to study the
formation of technologically important coatings of nickel aluminide.
The coatings were prepared by ion-beam mixing of stoichiometric Ni/Al
multilayer structure sputter-deposited on a silicon substrate at different
substrate temperatures in the range from -145°C to 330°C [4]. The diffusion
of Ni atoms into the Al matrix during the treatment has been established
by Auger electron spectroscopy (AES). The method, however, cannot tell
whether the diffused component remains in separate nanoparticles of
pure metal or whether the desired NiAl alloy is formed. X-ray diffraction
is of little help, since for temperatures below 400°C the coatings do
not relax into the long range order.
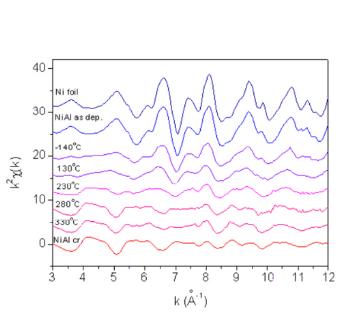 |
|
| Fig. 4 & 5. Ni K-edge EXAFS spectra (left) and their Fourier transform magnitudes (right) measured on the as deposited Ni/Al multilayer sample and on samples after ion mixing at substrate temperatures -140°C, 130°C, 230°C, 280°C and 330°C. For comparison the spectra of Ni metal and NiAl monocrystal are added. Solid line - experiment; dashed line - EXAFS model. The spectra were recorded at the XAS13 experimental station of the DCI storage ring at LURE, Orsay (France). | |
With Ni K-edge EXAFS
the local structure within the sphere of about 5 A radius around Ni
atoms is obtained. The basic facts about the structure can be deduced
already from the Fourier transforms (Fig. 4), even before the detailed
quantitative analysis is performed. The sequence of the FT spectra for
increasing substrate temperatures shows that there is indeed a change
from the pure fcc Ni structure in the as-deposited Ni/Al multilayer,
to the NiAl binary alloy structure after the application of the ion
mixing.
Quantitative EXAFS analysis is used to determine the ratio of the two
phases in each coating. EXAFS models based on crystal structures of
Ni metal (fcc) and NiAl binary alloy (CsCl structure) were constructed.
The treated Ni/Al coatings were described by a superposition of the
two models. The environments of Ni atoms in the two crystal structures
differ so much, that the analysis of the nearest neighbours up to 3
A is sufficient to identify the amount of each phase in the treated
samples.
The presence of the nickel aluminide phase is found only for substrate
temperatures above 230°C. For the two lowermost temperature points,
the presence of the first shell of Al neighbors is established, but
the observed Ni-Al bonds result merely from Ni atoms knocked off into
the Al layer. The medium is too cold to relax with diffusion into the
stoichiometric NiAl alloy. At the temperature of 280°C and above the
treatment of the coating leads to predominant nickel aluminide phase.
However, about 20% of Ni is still found in the metallic fcc phase.
|
|
|||||||||||||||||||||||||||||||||||||||||||||||||||||||||||
|
E-mail:iztok.arcon@p-ng.si Last change: 23/2/2004 |
|||||||||||||||||||||||||||||||||||||||||||||||||||||||||||