 |
 |
||||||||||
X-RAY ABSORPTION NEAR EDGE STRUCTURE
Published
in:
1)
A. Kodre, I.
Arčon, Proceedings of 36th International Conference on Microelectronics,
Devices and Materials, MIDEM, Postojna, Slovenia, October 28-20, 2000,
p.
191-196
2) I.
Arčon, B. Mirtič, A. Kodre, Determination of valence states of chromium
in calcium chromates by using X-ray Absorption Near-Edge Structure (XANES)
Spectroscopy, J. Am. Ceram. Soc. 81/1 (1998) 222-224
Abstract
With the availability of the synchrotron radiation sources, x-ray absorption spectroscopy techniques (XAS) developed into widely used tools for the structural research of materials by identifying the local structure around atoms of a selected type in the sample. In XANES (X-Ray Absorption Near Edge Structure) the valence state of the selected type of the atom in the sample and the local symmetry of its unoccupied orbitals can be deduced from the information hidden in the shape and energy shift of the x-ray absorption edge itself.
Introduction
In XANES (X-ray
Absorption Near Edge Structure) analysis, the shape of the absorption
edge itself is examined in high resolution scan. In the energy region
near an absorption edge the slow photoelectron probes the empty electronic
levels of the material. The resulting structure within about 30 eV of
the threshold is rich in chemical and structural information. Although
the theoretical picture is mostly too complex to allow a comprehensive
analysis, some features of the spectral shape can reliably be used to
determine the valence of the atom and the symmetry of its neighbourhood.
 |
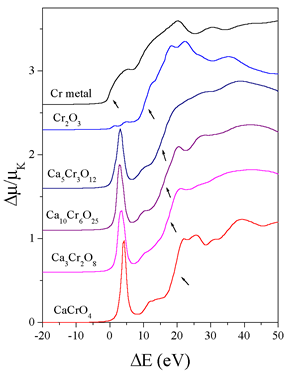
A recent study of Cr XANES spectra measured on crystalline samples with known crystal structures, containing chromium at different valence states, demonstrates the possibilities of such XANES analysis [5]. Normalised Cr XANES spectra of Cr2O3, CaCrO4, Cr metal and three newly synthesised calcium chromate samples Ca10Cr6O25, Ca3Cr2O8, and Ca5Cr3O12 are shown in Fig. 5. The shape
of the edge and the pre-edge resonances are characteristic for
the local symmetry of the investigated atom sites and can be used
as fingerprints in identification of its local structure [6].
Tetrahedrally coordinated Cr materials, lacking an inversion centre,
exhibit a single intense pre-edge peak which can be assigned to
a dipole allowed transition of 1s electron to an unoccupied antibonding
t2* tetrahedral orbital. This typical pre-edge resonance is found
in the CaCrO4 sample, as well as in all three new calcium chromate
samples, where Cr atoms are tetrahedrally coordinated by four
oxygen atoms. In the XANES spectra of Cr2O3 and Cr metal samples,
where Cr is located at the crystal site with the centre of inversion,
the pre-edge resonance does not appear. Cr2O3 builds a corundum
structure with Cr atoms occupying octahedral sites in the lattice.
Octahedral
symmetry in XANES spectra is recognised by two small resonances
in the pre-edge region assigned to transitions of 1s electron
into antibonding orbitals with octahedral symmetry. |
|
| Fig. 5. Normalized Cr K-edge profiles, displaced vertically, for the calcium chromate samples and Cr2O3, CaCrO4, and Cr metal. Energy scale is relative to the Cr K-edge in metal (5989.0 eV). The spectra were measured at EXAFS 2 beamline in HASYLAB at DESY in Hamburg. |
For chromium metal crystallising in body-centred cubic lattice, the XANES spectrum reflects the structure of the conducting bands in the metal.
| The
binding energies of the valence orbitals and therefore the energy
position of the edge and the pre-edge features are correlated with
the valence state of the absorbing atom in the sample. With increasing
oxidation state each absorption feature in the XANES spectrum is
shifted to higher energies. The energy shifts vary linearly with
the valence of the absorbing atom [6]. The largest shifts, up to
a few eV per oxidation state, are observed at the edge position.
Shifts of the pre-edge peaks are considerably smaller, of the order
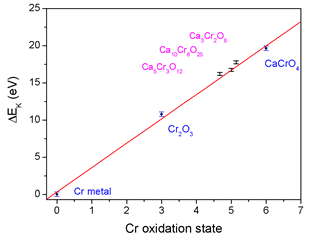
of a few tenths of eV. Energy shift of the Cr K-edge as a function of Cr valence is shown in Figure 6. The precise energy position of the edge is taken at the inflection point, denoted by the arrow in Fig. 5. A model linear function, determined as a best fit to the data from the three reference samples (Cr2O3, CaCrO4, and Cr metal) is added to the plot. From the same linear function, Cr valence in the new calcium chromates is calculated. |
 |
|
| Fig. 6. Energy positions of the Cr K-edge in chromates ( | ) and reference samples (o) vs. Cr oxidation state. Linear dependence based on the reference samples is shown by solid line |
|
|
|||||||||||||||||||||||||||||||||||||||||||||||||||||||||||
|
E-mail:iztok.arcon@p-ng.si Last change: 23/2/2004 |
|||||||||||||||||||||||||||||||||||||||||||||||||||||||||||