

Next: Central Tracking Chamber, CDC
Up: Silicon Vertex Detector, SVD
Previous: Monitor System
Contents
High SVD strip yields and good S/N ratios are needed to ensure the
efficient matching between tracks detected by CDC and clusters
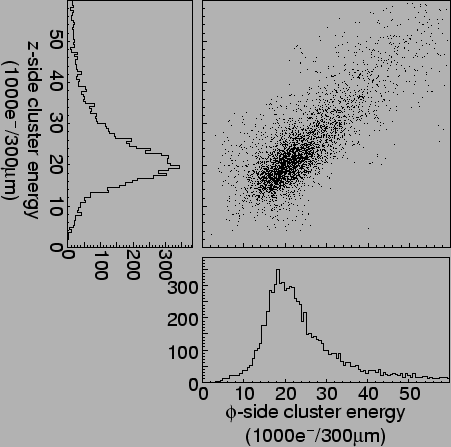
detected by SVD. Distributions of normalized cluster energies for
minimum ionizing particles (MIPs) from hadronic events are shown in
Fig. ![[*]](./icons/crossref.png) , where the cluster energy is normalized to
the same track path length in DSSD (300
, where the cluster energy is normalized to
the same track path length in DSSD (300  m). The measured
most-probable peak height is approximately 19,000 e
 . The noise
level and the S/N ratio for each DSSD side (
 ,
,  and
and  -
- ) are
summarized in Table
 ![[*]](./icons/crossref.png) . Strip yields, which are
defined to be the fraction of channels with S/N ratios larger than
10:1, are measured to be 98.8% on layer 1, 96.3% on layer 2, and
93.5% on layer 3 [28].
. Strip yields, which are
defined to be the fraction of channels with S/N ratios larger than
10:1, are measured to be 98.8% on layer 1, 96.3% on layer 2, and
93.5% on layer 3 [28].
Figure:
Cluster energy distribution in which the cluster energy is
normalized by the track path length in DSSD.
 |
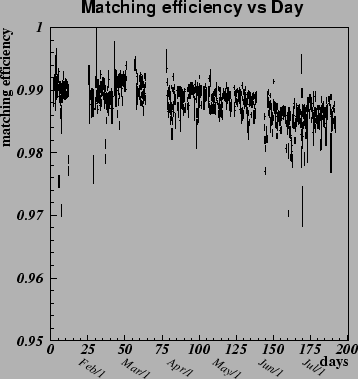
The track-matching efficiency is defined as the probability that a CDC
track within the SVD acceptance has associated SVD hits in at least
two layers, and in at least one layer with both the  -
- and
and
 -
- information. Tracks from
  decays were excluded since
these tracks did not necessarily go through SVD.
Fig.
 ![[*]](./icons/crossref.png) shows the SVD-CDC track matching
efficiency for hadronic events as a function of time. The average
matching efficiency is better than 98.7%, although we observe slight
degradation after one year operation as a result of the gain loss of
VA1 from radiation damage [28].
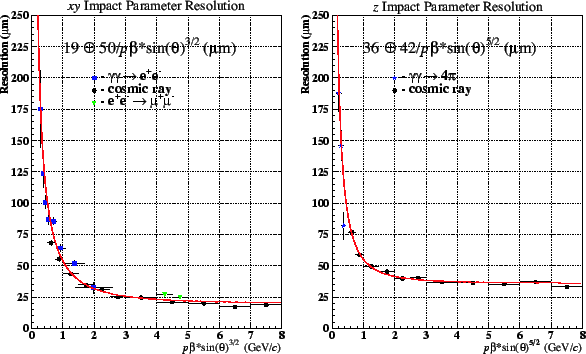
The momentum and angular dependence of the impact parameter resolution
are shown in Fig.
shows the SVD-CDC track matching
efficiency for hadronic events as a function of time. The average
matching efficiency is better than 98.7%, although we observe slight
degradation after one year operation as a result of the gain loss of
VA1 from radiation damage [28].
The momentum and angular dependence of the impact parameter resolution
are shown in Fig. ![[*]](./icons/crossref.png) and well represented by the
following formula:
and well represented by the
following formula:

 m and
m and

 m.
We performed the same study for the MC sample and obtained an IP
resolution of

 m and
m and

 m. This indicates that the IP resolution term dominated by the
scattering is well simulated by the MC data. The flat components are
larger in the real data than in the MC simulation, which indicates the
amount of remaining misalignment errors. Detailed description of
Belle SVD performance studies can be found
elsewhere [29].
Figure:
SVD-CDC track matching efficiency as a function of the date
of data taking.
 |
Figure:
Impact parameter resolution.
 |


Next: Central Tracking Chamber, CDC
Up: Silicon Vertex Detector, SVD
Previous: Monitor System
Contents
Samo Stanic
2001-06-02

