 |
 |
||||||||||
MULTIELECTRON EXCITATIONS IN X-RAY ABSORPTION SPECTRA
Related
publications:
1)
A. Kodre, I. Arčon, and J. Padežnik Gomilšek,
R. Prešeren, R. Frahm, J. Phsy. B: At. Mol. Opt.
Phsy. 35 (2002) 3497
- 3513
2) J. Padežnik
Gomilšek, A. Kodre, I. Arčon, M. Hribar, Phys.
Rev. A 68 (2003) 042505
Absorption spectrometry, the simplest spectroscopic technique in the x-ray field, has contributed important information on the detailed structure of the atomic system. The data it provides is simply proportional to the transition probability, almost without interference with instrumental effects, so that even a conversion to the absolute cross section is highly reliable. However, the technique provides only the total cross section: to distinguish between contributions of separate reaction channels, other techniques as e.g. emission spectroscopies are required. In the study of multielectron photoexcitation (MPE), a process which may probe directly the correlation in the motion of electrons, synchrotron measurements of x-ray absorption on noble gases have provided spectra with high sensitivity and practically lifetime-width resolution [1-12]. The MPE channels in these spectra are recognized by sharp threshold features superposed onto the smooth energy dependence of the dominant channel of the single-electron photoeffect. Tiny resonant peaks and absorption edges are identified as signatures of double excitations and shake-up transitions, respectively. In high quality spectra, a shake-off transition or double ionization can be recognized as a change of slope at the threshold [8]. Superposition of reaction channels can give rise to more complex spectral features [13].
 |
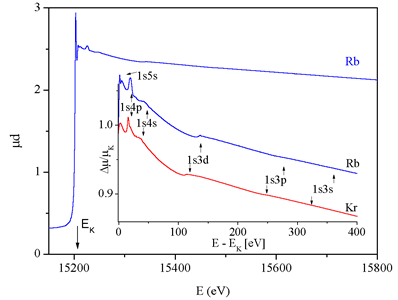
| Fig. 1. Absorption spectrum of Rb in the vicinity of K-edge (15206.9 eV). Inset: normalized above-edge spectra of Rb and Kr in the relative energy scale. Dirac-Fock estimates of thresholds of coexcitation groups are indicated. |
In addition to characteristic shape, the threshold energy is the
key for identification of the MPE channels: mostly, experimental
data are
compared with SCF (self-consistent field) energy estimates of candidate
excited states. For a definite assignment of MPE features, especially
in complex cases, a reconstruction of the experimental cross section
by a theoretical model is required. Good results have been obtained
for some isolated groups of excitations in noble gas spectra [8,
14-18]. The theoretical treatment, however, has been uniquely
adapted to each
case, allowing little generalization. An ab initio calculation of
the full range of MPE is still beyond the reach of the models.
In the absence
of theoretical data the interpretation of MPE spectra can be aided
by inclusion of additional experimental data as e.g. emission spectra
[1, 19-21]. The gradual evolution of spectral features in related
systems, such as isoelectronic series of ions [22-29], can
be used to the same
effect. In particular, the comparison of richly detailed MPE spectra
of the neighbors argon and potassium [27] provided insight into specifics
of their electronic structure.
In the present study, the atomic absorption of rubidium is compared to that of the neighbor noble gas krypton. The Rb data for the study are taken from a series of measurements on a Rb vapor cell [30] (Fig. 1, 2, 3). The absorption spectrum of the monatomic metal vapor is free of the structural signal (XAFS) so that pure MPE features are recovered in detail comparable to that in the spectra of noble gases. The spectra in the series have been obtained over a longer period in experimental runs at different synchrotron beamlines, with improving energy resolution and signal-to-noise ratio stemming from improvements in the cell design and monochromator characteristics. Although the latest (and best) data will be used in the presentation, the consistency of the entire series provides a guarantee against contamination of the MPE data with monochromator artifacts.
 |
 |
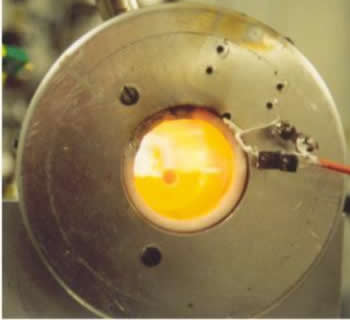
| Fig 2. Top: side view of the stainless-steel absorption cell for rubidium and cesium vapor: 1 - tube, 2 - windows, 3 - sample. Bottom: the cell after the experiment. |
The MPE spectrum of krypton has been extensively studied [3-8].
It has served as a test case for several new approaches in the
analysis.
Schaphorst et al. [8] built a quantitative
MPE model of the major excitation channels resolved in the modest
sensitivity of the experiment.
The
improved resolution and sensitivity in the experiment by Filipponi
opened up the way to the technique of the natural-width deconvolution [34].
The Kr data, analyzed in the present report, were remeasured at
the same experimental station.
From the earlier data in the Rb series the XAFS atomic absorption
background of Rb has been constructed [31,32],
and, with an additional normalization
measurement, the absolute Rb photoabsorption cross section [33].
In the present paper, a comprehensive explanation of the absorption
spectrum
is given on the basis of the energy levels of single and multiple
excitations of the Rb and Kr atoms. Energy estimates from Hartree-Fock
and Dirac-Fock
self-consistent atomic models, including the effect of configuration
interaction are used in identification of MPE features. In the
parallel analysis of Kr and Rb we exploit the fact that the cores
of the two
atoms are largely the same, apart from the unit difference in the
nuclear charge, and rubidium has an additional loosely bound electron
in the
5s shell. It is shown how the common features in the spectra follow
from a specific interaction of core configurations, while the differences
in the MPE features stem from the additional coupling of the Rb
5s electron and the collapse of the 4d orbital in some excited
states
of Rb.
Instead of a reconstruction of the MPE cross-section ab initio
which requires a much more potent theoretical apparatus, our quantum-mechanical
explanation of the MPE features is based on a full scale modeling.
With sufficient quality of spectra available on the latest generation
of synchrotron x-ray sources the spectral features can be modeled
quantitatively by linear combinations of theoretical energy profiles
of reaction channels.
The identification of the features is thus transferred to the much
more transparent manifold of model parameters where a priori physical
constraints (energy splitting, intensity ratios, widths) can be
easily
taken into account or even introduced into the modeling step. The
basic tenet of the approach is that with sufficiently low level
of noise
even the features that are lost from view due to a low amplitude
or a large width, leave a mark deeper in the dynamical range of
the bin
count and can, consequently, be recovered numerically.
In the related technique of natural width deconvolution [34] the
identification of spectral features is facilitated by suppression
of the linewidth
in a numerical transformation without a specific model. It has
been shown in some earlier attempts [35-37] that
the energy resolution of spectral features can be improved at the
expense of signal-to-noise
ratio. Filipponi has published a general purpose algorithm, implemented
in a computer program by which the entire natural width can be
removed and substituted by a considerably smaller gaussian width [34].
Although the deconvolution can always be simulated after a successful
modeling,
its advantages are the immediate visualization and applicability
to
cases where a model is not evident.
The success of both techniques, however, depends critically on
the signal-to-noise ratio. Even with the brightness of modern synchrotron
x-ray sources a sufficiently low noise is hardly achieved in a
single
scan: averaging over several identical scans to suppress noise
is usually required for a meaningful exploitation of either technique.
Absorption spectra of krypton and rubidium vapor in the K edge region were measured at the X1 station of the HASYLAB at Deutschen Elektronen-Synchrotron DESY (Hamburg, Germany), and at the beamline BM 29 of the ESRF in Grenoble, France. Fixed-exit Si(311) double-crystal monochromators were used, with FWHM resolution of 2 eV and 1 eV, respectively, at 15 keV. The values were chosen above the monochromator geometrical limit to retain the intensity: the sharpness of the spectral features could hardly be improved by additional decrease of experimental width in view of the ~3 eV natural width. The harmonic components of the beam were suppressed by detuning the monochromator to the 60 % point of the rocking curve. The flux of the incident monochromatic x-ray beam and the flux of the transmitted beam through the sample were measured by ionization detectors filled with argon.
 |
 |
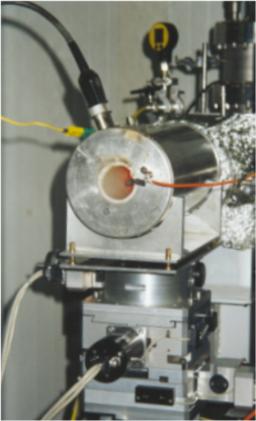
| Fig. 3: Left: Oven for the metal-vapor absorption cell ( T = 800°C ). Right: Experimental setup during measurements at the BM29 beamline of ESRF | |
Atomic
Rb sample was prepared in a metal-vapor cell (Fig. 2)
constructed to contain dense vapor with the absorption length of the
order
of unity
[30]. By monitoring
the absorption in the cell as a function of the
temperature, the working point was chosen slightly
above
the temperature
where the metal was completely vaporized
(vapor
pressure 71,3 kPa at 690°C), to stabilize the sample
density (Fig. 3). The Kr gas sample
was contained
in a glass cell sealed by kapton
windows with Kr absorption thickness of unity
above the K edge. The energy scale
of the monochromator
was calibrated with the features
of the Kr K edge [38].
The reproducibility of the energy scale in Rb
absorption scans was established
with
a parallel
measurement of the Pb L2 edge (15200
eV). The contributions of the window absorption and of
the energy-dependent
detector
efficiency
was exactly determined in a reference
measurement in situ, by removing the gas from the beam
path, either by evacuating
(Kr)
or by cooling
the cell (Rb).
The absorption coefficient for Kr and Rb in the energy region above the K edge is shown (Fig. 1) as a superposition of 5 and 15 experimental runs, respectively. The features seen in the two spectra are remarkably similar. Common to both are a group of resonances within 60 eV above the K edge and two points of discontinuity of slope (140 eV and 280 eV in Rb). Using Dirac-Fock (DF) [39] estimates of excitation energies, the features are attributed to coexcitations of electrons from consecutive subshells. Apart from these sharp features, the region from the K edge to the 3d group exhibits a steeper slope than the region further out. Thus, the photoabsorption cross section immediately above an inner-shell edge is larger than the value extrapolated from the asymptotic trend. The observation, found in all noble-gas experiments, has been explained as a contribution of core relaxation (CR) and post-collision interaction (PCI) in Auger decay of the core hole [40,41].
|
|
|||||||||||||||||||||||||||||||||||||||||||||||||||||||||||
|
E-mail:iztok.arcon@p-ng.si Last change: 29-Jun-2006 |
|||||||||||||||||||||||||||||||||||||||||||||||||||||||||||