 |
 |
||||||||||
| MPE | ||||||||||||||||||||||||||||||||||||||||||||||||||||||||||||||||||||||||||||||||||||||||||||||||||||||||||||||
Analysis
The MPE features in the absorption spectra of Kr and Rb will be discussed
following the order of the well-separated groups of coexcitations
of consecutive subshells. The introductory analysis of the K edge
reveals some details of configuration interaction and coupling useful
in explanation of the weaker subshell MPE features. The region of
the steeper slope is discussed separately. The model of the CR/PCI
contribution extending over the entire MPE spectrum is described
with a heuristic ansatz to provide a clearer view of the MPE.
Both deconvolution and comprehensive modeling of the features are used
to sharpen the detail and to facilitate the identification of excitation
channels. The model decomposition of features is shown in the simpler
cases of deep MPE, while for the complex subvalence MPE (1s5s, 1s4p
and 1s4s) the deconvoluted picture provides better insight.
In modeling, the MPE features are reconstructed by a superposition
of three types of functional components: Lorentzian peaks
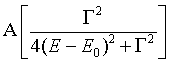 |
for resonant channels, cumulative Lorentzian distribution
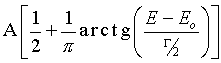 |
for shake-up edges, and exponential saturation profiles
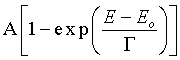 |
for shake-off channels.
The first two are characterized by three standard parameters, the
amplitude A, the width ![]() , and the energy Eo. In exponential saturation,
the energy
parameter is the threshold of the shake-off channel, and the width
is given by the range, i.e. the reciprocal of the saturation constant.
For resonant lines, the intensity will be given as the product of
the amplitude and the width so that a comparison between groups
and elements
is enabled.
, and the energy Eo. In exponential saturation,
the energy
parameter is the threshold of the shake-off channel, and the width
is given by the range, i.e. the reciprocal of the saturation constant.
For resonant lines, the intensity will be given as the product of
the amplitude and the width so that a comparison between groups
and elements
is enabled.
For the shake-off channel another theoretical ansatz (Thomas profile)
has been derived from a statistical description of the process [20].
The comparison with satellite emission data on Cu [19] shows that
an exponential saturation profile can be adapted to a closer fit.
Since
this functional form also follows from the statistical description
with a slightly different yet entirely physical assumption on the
momentum density we adopt it in the present study. The range of the
exponential
is proportional with the excess energy, i.e. the binding energy of
the shaken electron. The coefficient of proportionality in Cu data
is 0.4, and the same value will be used here, in satisfactory agreement
with the data.
K-edge
The deconvolution is best exploited in the region of major absorption
edges where the obscuring effect of strong and extensive tails of
the edge and the accompanying resonance lines is removed and finer
features become visible. In Kr and Rb, the deconvoluted K edge regions
appear almost identical to those of the lighter homologues Ar and
K (Figs 4 a,b) when intensity relative to the K edge jump is considered
and the energy scale relative to the K edge is used. The span of
edge features in Rb and Kr appears slightly contracted since the
excited states are less tightly bound due to a weaker penetration
of outer electrons to the core.
 |
 |
| Fig. 4. Normalized Kr and Rb K-edge (solid) and some of the model components (dashes, dots) - see Table 1. The deconvoluted spectra (dash-dots) are compared, respectively, to argon and potassium K-edge (above). Dirac-Fock energies are indicated. Energy scale here and subsequently as explained in Table1. | |
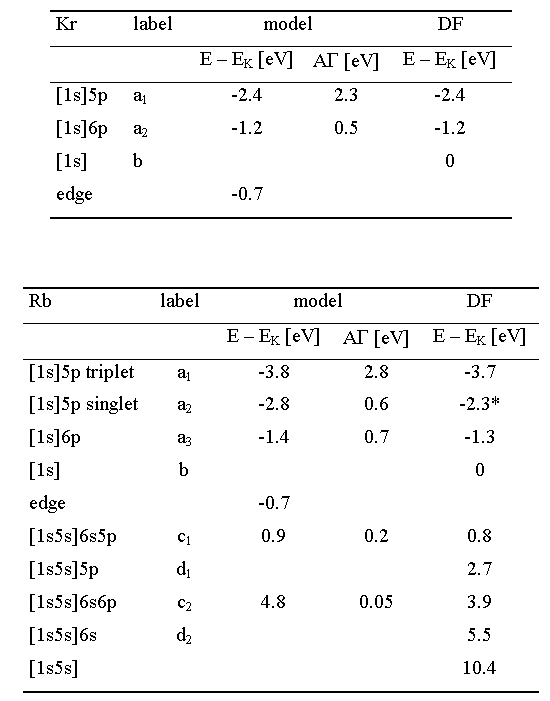
The simple edge shape of Kr can be modeled with just three elements
(Table 1 a), the resonant peak of the [1s]5p transition, its Rydberg
follower [1s]6p, and the K edge [1s] itself. The position of the
model edge is shifted from the DF estimate by 0.7 eV, owing
to the accumulation
of unresolved lines of the Rydberg series [42].
In Rb, considerable additional detail is introduced by the presence
of the valence 5s electron (Table 1b). As in the case of potassium,
the DF calculation shows that in the resonant [1s]5p state the coupling
is pure (5s5p)1s, leading to a triplet-singlet splitting of 1.9 eV.
Configuration interaction (CI) suppresses the splitting; the definite
value is not known for convergence problems in the DF code. The extrapolation
from DF models with artificially increased nuclear charge points
to a value 1.4 eV, obtained at Z eff. = 37.15. The least-square value
from
experimental data is 1 ![]() 0.3
eV, with the intensity ratio of the two components of 4,8 : 1.
0.3
eV, with the intensity ratio of the two components of 4,8 : 1.
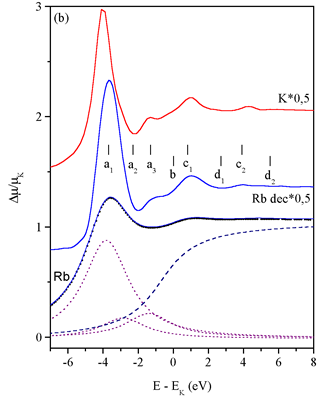
The coexcitations of the 5s valence electron follow immediately above
the [1s] edge. The resonant peak due to the [1s5s]5p6s transition
is plainly visible in the measured spectrum. The deconvolution reveals
also the Rydberg resonance [1s5s]6p6s and the shake-up edges [1s5s]5p
and [1s5s]6s. The latter, stemming from the ordinary shake promotion
of the valence electron in the 1s photoeffect, appears stronger than
the reverse possibility of the valence monopole ejection accompanying
a dipole 1s ![]() 5p excitation.
5p excitation.
| Table
1. Best-fit
model parameters of the normalized Kr and Rb K-edge and calculated
Dirac-Fock energies of the corresponding electron transitions
relative to the *at increased nuclear charge Z = 37.15 (see text). |
|
Core
relaxation and PCI
If quantitative agreement with experimental data is required even the
theoretical reconstruction of the dominant single-electron photoabsorption
channel without MPE contributions represents a difficult task, as
shown in the analyses of the Kr K edge [5,8]. The asymptotic decrease
of the photoelectric cross section far above the edge can be described
sufficiently well by a Victoreen power formula ![]() , n around 3, but
for the region of steeper slope immediately above the edge a quantitative
model has not yet been given. In Fig. 1, the region seems to reach
as far as the 1s3d MPE group. According to Tulkki [40], the cross
section calculated with inclusion of core relaxation and PCI effects
exceeds the unrelaxed cross section immediately above the edge but
approaches it asymptotically. The contribution of the relaxation
and PCI may thus be regarded as superposed onto the single electron
cross section. Its overall effect in the Kr absorption spectrum has
already been discussed by Deutsch et al. [5,11].
, n around 3, but
for the region of steeper slope immediately above the edge a quantitative
model has not yet been given. In Fig. 1, the region seems to reach
as far as the 1s3d MPE group. According to Tulkki [40], the cross
section calculated with inclusion of core relaxation and PCI effects
exceeds the unrelaxed cross section immediately above the edge but
approaches it asymptotically. The contribution of the relaxation
and PCI may thus be regarded as superposed onto the single electron
cross section. Its overall effect in the Kr absorption spectrum has
already been discussed by Deutsch et al. [5,11].
The presence of the CR/PCI contribution affects the definition of the
edge amplitude. To maintain the consistency with tabulated absorption
data we define the amplitude of the edge as the Victoreen extrapolation
from values far above the edge. It is thus the photoabsorption cross
section with saturated shake channels, extrapolated to the edge energy.
The extrapolation, however, excludes the CR/PCI contribution since
it dies out before the asymptotic region.
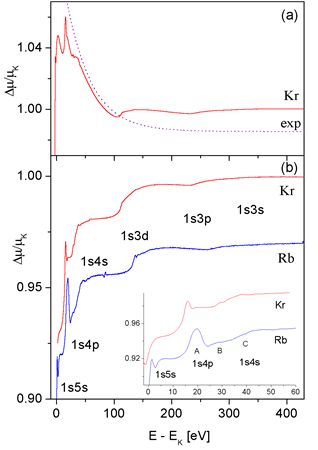 |
| Fig. 5. a:- Kr absorption cross section normalized to the asymptotic Victoreen formula; an arbitrarily shifted exponential ansatz for PCI contribution; b: - reduced MPE spectrum of Kr and Rb after removal of the best-fit exponential. The inset shows an expanded view of the complex region just above the edge with 1s5s, 1s4p and 1s4s excitations. Labels A - C are discussed in text. |
In analysis of MPE groups it proves useful to eliminate from the
measured absorption spectrum the Victoreen trend since its
slope affects the
shapes of weaker MPE details. Following the above discussion, we
divide the experimental cross section by the Victoreen cross
section, determined
in a least-square fit in the high-energy region above perceptible
MPE features. The renormalized spectrum is seen as a slow decrease,
interspersed
with sharp MPE features, from the K edge to the asymptotic unit value
(Fig 5a).
The smooth segments of the spectrum between MPE groups look as parts
of a single continuum with steadily decreasing slope. In an attempt
to describe the continuum with a simple function of energy, an exponential
is found to fit surprisingly well. Indeed, the exponential determined
to fit the most conspicuous smooth spectral region between 1s4s and
1s3d MPE groups remains roughly parallel also with the flat segments
on either side. Its removal results in a reduced cross section (Fig.
5b) that increases stepwise to the asymptotic value of 1. The monotonous
increase, if the narrow resonant contributions are momentarily disregarded,
follows from the succession of the shake-up and shake-off channels.
Several ambiguous MPE features as e.g. sharp spikes of the 1s4p group
can now be clearly identified: after removing of additional slope
the resonant and shake-up channels are easily discerned. Likewise,
the
saturation profile of shake-off channels is made evident.
The same procedure is successful for Rb. The reduced cross sections
of Fig 5b will be used in the analysis of MPE in Kr and Rb, and the
channel strengths will refer to the particular renormalization discussed
above. The exponential ansatz, however heuristic and approximate,
applies also in other similar cases, as in the high-resolution absorption
spectra
of hydrides of the 4p elements [43]. Even
the 20 eV long stretch of smooth cross section between the edge and
the valence MPE group
(1s3p)
in the spectra of Ar and K [27] fits an
exponential well. The effective range of the exponential shows a
distinct increase with atomic number
Z (Table 2).
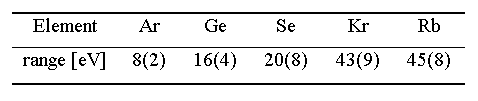
| Table 2. Range of the exponential ansatz for some elements. The numbers in brackets indicate the uncertainty of the last digit. |
 |
|
|
|||||||||||||||||||||||||||||||||||||||||||||||||||||||||||
|
E-mail:iztok.arcon@p-ng.si Last change: 28-Jun-2006 |
|||||||||||||||||||||||||||||||||||||||||||||||||||||||||||