 |
 |
||||||||||
A STUDY OF TRANSFERABILITY OF ATOMIC ABSORPTION BACKGROUND ON EXAFS SPECTRA OF SIMPLE GASEOUS COMPOUNDS OF As
Related publications: A. Kodre, R. Prešeren, I. Arčon, J. Padežnik Gomilšek, M. Borowski, J. Synchrotron Rad., 8, (2001), p. 282-284 (reprint)
Introduction
In precision EXAFS structure determination, the conventional spline reconstruction of low-wavenumber components cannot satisfactorily describe non-structural, intra-atomic effects. In particular, sharp features such as small resonances and absorption edges, introduced into absorption spectra by multielectron excitations, contribute non-negligible high-wavenumber components which can interfere with the structural signal (Frahm et al., 1984; Kochur et al., 1986; Kodre et al., 1994; Chaboy et al., 1994; Kodre et al., 1995; Filipponi, 1995; Filipponi & Di Cicco, 1995; Kodre et al., 1997; Arčon et al., 1997; Padežnik Gomilšek et al., 1999). Thus, a true atomic absorption background (AAB) from an independent measurement or calculation is required. Some of the scarce available data on AAB is constructed from semi-empirical models (Di Cicco, 1995; Di Cicco et al., 1996; Arčon et al., 1997), some is recovered from standard EXAFS samples (Li et al., 1992; D'Angelo et al., 1993; Bridges at al., 1995; D'Angelo et al., 1995; D'Angelo et al., 1996; Padežnik Gomilšek et al., 1999-a). A similar approach has been exploited in AXAFS (atomic EXAFS) investigations (Holland et al., 1978; Rehr et al., 1994). For a very small number of elements AAB can be measured directly and with high accuracy on monatomic gaseous samples (Schaphorst et al,. 1993; Filipponi et al., 1993, Kodre et al., 1997, Prešeren et al., 1996; Prešeren et al. 1999; Prešeren & Kodre, 1999-a). It has been shown that simple molecular gases can also be used for the purpose (D'Angelo et al., 1993; Prešeren et al., 2000). Exploiting this approach we have devised a direct test of the transferability of AAB of an element. The concept of transferability is generally assumed, in view of the intra-atomic origin of the AAB, but it has hardly been supported by convincing experimental evidence. (However, in the AXAFS interpretation, the transferability is limited to similar environments of the atom.) In this study, we compare AAB extracted from three gaseous compounds of arsenic.
Experiment
Arsine, AsH3, is
a stable gas at room temperature. A 60 mm long glass absorption cell
with kapton windows was filled with 40
kPa of arsine,
yielding absorption md ~ 1.7 at the As K edge. Arsenic trioxide,
As2O3, sublimates at temperatures above 300°C. As its vapor reacts
slowly with most of conventional cell and window materials, a sample
of 12 mg of As2O3 was sealed in a 200 mm long absorption cell of
Duran glass with 0.3 mm thick windows of the same material. The
absorption in the windows contributed md ~ 2, and the absorption
in the sample,
when completely vaporized at 320°C, md ~ 1.7. At this temperature,
it took ~1 hour before the oxide reacted with glass appreciably.
Elemental arsenic is also known to sublimate above 500°C. At this
temperature, it reacts vigorously with standard high-temperature
cell and window
materials, stainless steel, quartz, and glass. In the latter, however,
the reaction is relatively slow, so that a single spectrum of 20
min duration could be recorded. A 300 mm long Duran cell with 0.3
mm thick
Duran windows was used, operated at 490°C, yielding md ~ 0.3 at
the As K edge.
The As K edge absorption spectra of As2O3 vapor and AsH3, were measured
at BM 29 of the European Synchrotron Radiation Facility (ESRF) in
Grenoble, France. The absorption spectrum of As vapor was measured
at the X1
station of the Doris ring in Hamburger Synchrotronstrahlungslabor
HASYLAB at Deutschen Elektronen-Synchrotron DESY (Hamburg, Germany).
At both
beamlines a Si(311) fixed-exit double-crystal monochromator was used.
The resolution at 12 keV was 0.8 eV at BM29 and 1.5 eV at X1. Harmonics
were effectively eliminated by detuning the monochromator crystal
using a stabilization feedback control. Ionization cells filled with
argon
were used to detect the incident flux of the monochromatic x-ray
beam and the flux transmitted through the sample.
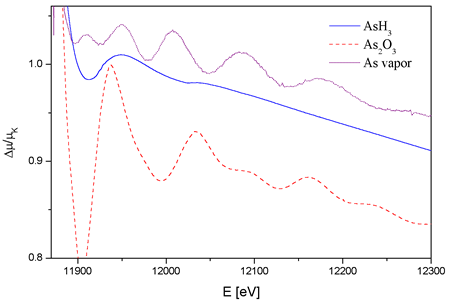 |
| Fig. 1. The normalized As K edge
absorption spectra of gaseous AsH3 (solid line), As2O3 vapor (dashed line) and
As vapor (dotted line). The spectra are slightly displaced
along vertical axis for clarity. The absorption cell of arsine was equipped with a side chamber into which the gas could be frozen in situ to obtain a precision reference measurement of the window transmission and energy dependence of detector efficiency. Reference spectra for arsenic trioxide and elemental arsenic were taken on the cells at room temperature before heating. |
Experimental results
The quality of
the spectra (Fig. 1) differs considerably between the three compounds,
as a consequence of different experimental conditions.
The stable gas arsine, in a cell with kapton windows, gives a spectrum
comparable to the state-of-the-art noble-gas spectra. With superposition
of 10 independent scans, the signal-to-noise ratio of 4*10^4 is
achieved. The resolvable level of detail is very high as shown in
the derivative
spectra in the insets of Fig. 2. The structural signal, resulting
from the photoelectron scattering on the H neighbors is smooth
and relatively weak so that the sharp features of the As AAB are
plainly
visible.
The quality of the spectrum of arsenic oxide is appreciably diminished
by the strong absorption in the windows. The structural signal of O
and As neighbors is prevailing, so that the features of the AAB cannot
be readily observed. The noise level is larger than in arsine by an
order of magnitude.
The noise level in the spectrum of arsenic vapor is larger still, of
the order of 10^(-3), mainly due to the lower density and the absorption
in glass windows. The spectrum exhibits a strong structural signal
of As neighbors since the vapor contains As4 molecules.
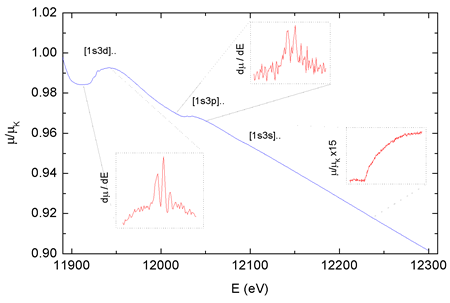 |
| Fig. 2. The normalized As K edge absorption spectrum of AsH3 gas. The insets show derivatives of the spectrum in the region of 1s3d and 1s3p multielectron photoexcitation and a magnified region of the 1s3s excitation. |
Analysis
In order to extract
AABs, the structural signal for all three molecules was modeled in
FEFF 6 code (Rehr et al., 1992; Stern et
al., 1995) and removed from the spectra. For AsH3, it is possible to construct
the EXAFS signal ab initio from known interatomic distances and angles
(Greenwood & Earnshaw, 1984), scattering factors, and vibrational
modes of the molecule (Cyvin, 1968). The ab-initio construction is
imperative since there is little possibility of adjusting the FEFF
model parameters by a best-fit procedure to the indinstinct structural
signal in the measured spectrum.
For As2O3 vapor, the conventional semiempirical FEFF model is employed:
the geometry of the molecule, a tetrahedron of As atoms with O atom
links along edges, actually corresponds to the dimer As4O6. Positions
of the atoms and the scattering data are introduced ab initio. The
Debye-Waller factors, however, are determined by best-fit to the
well-resolved structural signal. The model contribution of the first
(O) and the
second (As) neighbors, together with some weak higher order-scattering,
explains the two major peaks in the FT spectrum remarkably well.
However, after removal of the model signal, the remaining atomic background
still shows a small contribution of short-wave components that cannot
be accounted for by the scattering paths within the molecule. They
are mostly explained as an absorption signal from a very small quantity
of crystalline As2O3, adsorbed on the cell windows. Indeed, with
addition
of scattering paths in solid As2O3 to the model, the quality-of-fit-measure
in the FEFFIT procedure, the r-factor of 0.001 is obtained.
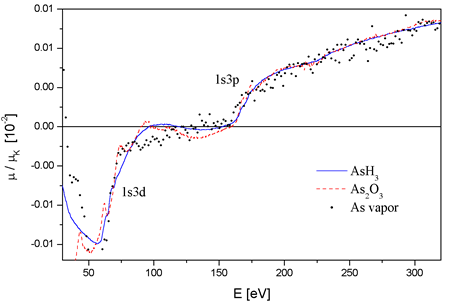 |
Fig.
3. The comparison of AAB extracted from absorption spectra
of three As molecules. The common energy scale is defined relative
to
the respective energies of the As K-edge. |
For As vapor, the same semiempirical approach is employed, with
an additional modification. According to chemical data (Cyvin,
1968;
Greenwood & Earnshaw,
1984), the As molecule in the vapor is tetraatomic in the range of
temperatures in the experiment. The FEFFIT procedure, however, gives
an essential improvement in the fit at the non-integer number of
neighbors N = 3.8, indicating a mixture of tetraatomic molecules
and larger aggregates.
Conclusions
The AABs of the
three As molecules are shown in Fig. 3. Although they differ appreciably
in quality, the As2O3 background ridden
by residual
shortwave components and the As background by the large noise,
the three spectra are clearly identical with relative deviations
below
3´10-3 and on the level of resolution of routine EXAFS analysis,
so that a unique As atomic background can be defined for most
practical purposes. The non-transferable part of AAB, due to
alternative mechanisms
such as AXAFS, is thus limited to a smooth contribution with
amplitude of deviations mentioned above.
The sharp features of the background have been identified as
fingerprints of two-electron excitations (Prešeren,
2000-a):
indeed, they can be
decomposed into contributions of resonant and shake channels
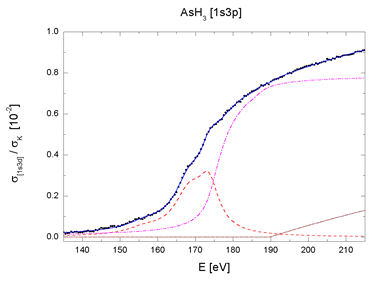
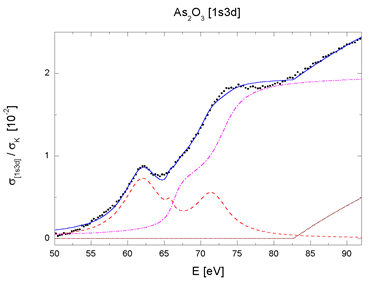
for the two major excitation groups, 1s3d and 1s3p (Fig. 4).
The energies of
the channels lie within a few eV of energies calculated by a
Dirac-Fock relativistic self-consistent model of the As atom.
For an atomic calculation,
the mismatch is relatively large. It is caused by the fact that
the excited states are molecular in character: the hybridization
of electronic
orbitals in a molecule introduces a shift of a few eV from the
corresponding atomic energy levels which are modelled in the
self-consistent calculation.
The complete decomposition of the sharp AAB features of AsH3
and As2O3 shown in Fig. 4 testifies that they arise entirely
from the internal
atomic dynamics, namely, the collective response to the photoexcitation.
There is another remarkable fact in support of the finding: the
parameters by which the components are described - energies,
amplitudes and linewidths
- are identical within experimental error for both molecules,
with exception of the width parameter. The smaller effective
width of resonances
in the oxide spectrum accounts for their relative prominence.
Thus, the transition probabilities which define the shape of
the jumps in
AAB are essentially the same for both molecules. The observed
small differences between the two sharp AAB features can be attributed
merely
to different widths of the lowermost unoccupied molecular levels.
Figure 3
The comparison of AAB extracted from absorption spectra of three
As molecules. The common energy scale is defined relative to
the respective energies of the
As K-edge.
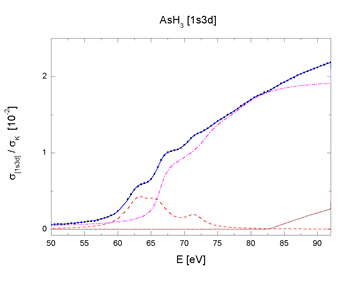 |
 |
 |
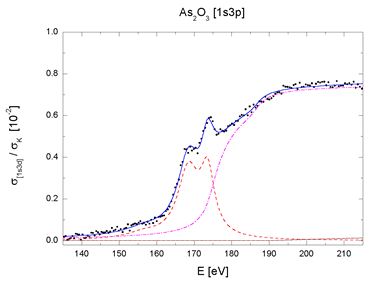 |
| Fig. 4. The [1s3p] and [1s3d] multielectron photoexcitation features in AsH3 and As2O3 absorption spectra decomposed into contributions of resonant (dashed line), shake-up (dot-dashed line) and shake-off channels (dotted line). Sum (solid line) and experiment (bullets). | |
Acknowledgment:
The study is supported by Internationales Büro des
BMBF, Germany and Ministry of Sciences and Technology, Slovenia. L.
Troeger from HASYLAB provided expert advice on beamline operation.
The experiment at the BM29 beamline of ESRF was performed under proposal
No. HE-375.
|
|
|||||||||||||||||||||||||||||||||||||||||||||||||||||||||||
|
E-mail:iztok.arcon@p-ng.si Last change: 31-Mar-2004 |
|||||||||||||||||||||||||||||||||||||||||||||||||||||||||||