 |
 |
||||||||||
Results
3.2.1. X-ray powder diffraction. XRD analyses were performed on the soil samples to reveal crystalline phases. In all samples alpha-quartz (![]() -SiO
-SiO![]() ) was found. In the low As concentration soil samples (R075 and R076) additional mica or muscovite (K, Mg, Fe, Al silicate hydrate) was found; the XRD diffractograms were very similar but no arsenic-containing phases were detected, implying that they were in amorphous or poorly-crystalline form or below the detection limit. In the high As concentration soil samples (R077 and R078) additional casserite (SnO
) was found. In the low As concentration soil samples (R075 and R076) additional mica or muscovite (K, Mg, Fe, Al silicate hydrate) was found; the XRD diffractograms were very similar but no arsenic-containing phases were detected, implying that they were in amorphous or poorly-crystalline form or below the detection limit. In the high As concentration soil samples (R077 and R078) additional casserite (SnO![]() ), alpha-hematite (Fe
), alpha-hematite (Fe![]() O
O![]() ) and iron arsenate (Fe
) and iron arsenate (Fe![]() (As(AsO
(As(AsO![]() )
)![]() )) were found. Surprisingly the As-containing phase is not the anticipated scorodite but an unexpected non-classified mineral (tris(arsenate)arsenite of Fe(III)) containing both tri- and pentavalent arsenic in its structure (D'Yvoire and Nguyen Huy-Dung, 1979). XAS should elucidate the remaining amorphous or poorly-crystalline arsenic fraction in the soil samples.
)) were found. Surprisingly the As-containing phase is not the anticipated scorodite but an unexpected non-classified mineral (tris(arsenate)arsenite of Fe(III)) containing both tri- and pentavalent arsenic in its structure (D'Yvoire and Nguyen Huy-Dung, 1979). XAS should elucidate the remaining amorphous or poorly-crystalline arsenic fraction in the soil samples.
3.2.1. X-ray absorption spectroscopy. The XANES (X-ray absorption near-edge structure) and EXAFS (Extended X-ray Absorption Fine Structure) spectra at the As K-edge were used to directly probe the average As valence and to retrieve the local structure around As atoms in the soil samples, respectively.
XANES. The average As valence in the soil samples can be obtained from the energy position of the As K-edge (Foster et al., 1998; Nicolis et al., 2001). With an increasing oxidation state the K-edge is shifted to higher energies. For a given type of ligand, a linear relation between the edge shift and the valence state was established (Wong et al., 1984, Arčon et al., 1998). For As, the relation can be calibrated with XANES spectra of reference compounds with well-defined oxidation states. For this purpose we measured As XANES spectra of the following As compounds and minerals: metallic As, trivalent As (realgar [AsS], orpiment [As![]() S
S![]() ], synthetic NaAsO
], synthetic NaAsO![]() and arsenolite [As
and arsenolite [As![]() O
O![]() ]) and pentavalent As (monomethyl arsonic acid [CH
]) and pentavalent As (monomethyl arsonic acid [CH![]() AsO(OH)
AsO(OH)![]() ], dimethyl arsinic acid [CH
], dimethyl arsinic acid [CH![]() )
)![]() AsO(OH)
AsO(OH)![]() ], scorodite [FeAsO
], scorodite [FeAsO![]() .2H
.2H![]() O], pharmacosiderite [KFe
O], pharmacosiderite [KFe![]() (AsO
(AsO![]() )3(OH)
)3(OH)![]() .6-7H
.6-7H![]() O]). The normalized As XANES spectra of the soil and reference samples are shown in Figure 5. The relative K-shell contribution is obtained from the measured absorption spectra by removing the extrapolated best-fit linear function determined in the pre-edge region (-250..-70 eV). The spectra are normalized to a unit As K-edge jump. Zero energy is taken at the first inflection point in the As metal spectrum at (11866.7 eV), which marks the 1s ionization threshold in As metal. The edge profiles of the soil samples are very similar to those of the reference As(V) minerals scorodite and pharmacosiderite, which suggests a similar local symmetry for the As atom. The vertical dashed line at the peak position of the spectra of As(V) minerals in Figure 5 facilitates comparison of edge shifts. The edge position in all soil samples coincides with those of the As(V) minerals, which clearly indicates that arsenic in all soil samples studied is predominantly in pentavalent form. The presence of a small amount of trivalent As from the crystalline fraction Fe
O]). The normalized As XANES spectra of the soil and reference samples are shown in Figure 5. The relative K-shell contribution is obtained from the measured absorption spectra by removing the extrapolated best-fit linear function determined in the pre-edge region (-250..-70 eV). The spectra are normalized to a unit As K-edge jump. Zero energy is taken at the first inflection point in the As metal spectrum at (11866.7 eV), which marks the 1s ionization threshold in As metal. The edge profiles of the soil samples are very similar to those of the reference As(V) minerals scorodite and pharmacosiderite, which suggests a similar local symmetry for the As atom. The vertical dashed line at the peak position of the spectra of As(V) minerals in Figure 5 facilitates comparison of edge shifts. The edge position in all soil samples coincides with those of the As(V) minerals, which clearly indicates that arsenic in all soil samples studied is predominantly in pentavalent form. The presence of a small amount of trivalent As from the crystalline fraction Fe![]() (As(AsO
(As(AsO![]() )
)![]() ), present in the soil samples R077 and R078, is indicated by a small shoulder below the As K-edge in the respective XANES spectra.
), present in the soil samples R077 and R078, is indicated by a small shoulder below the As K-edge in the respective XANES spectra.
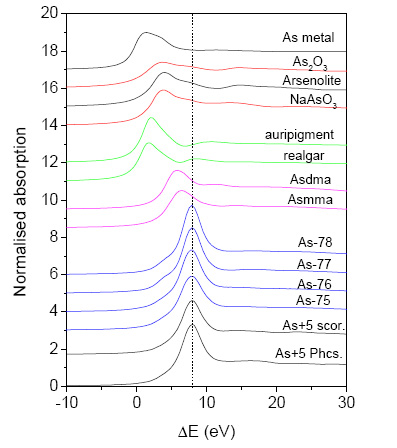
Figure 5: Normalized As K-edge profiles, for soil samples and reference As compounds and minerals. The energy scale is relative to the As K-edge in As metal (11866.7 eV). The spectra are displaced vertically for clarity.
EXAFS. A more detailed look into the local structure around the As atom in the soils can be obtained from As K-edge EXAFS analysis. The EXAFS analysis was performed with the University of Washington analysis programs using FEFF6 code for ab initio calculation of scattering paths. (Stern et al., 1995; Rehr et al., 1992). We performed EXAFS analysis using exact As atomic absorption background [14,15] to separate EXAFS signal from the absorption spectrum (Figure 3). The k![]() weighted EXAFS spectra of the soil samples and the reference As(V) mineral scorodite are shown in Figure 6, together with the best fit EXAFS models. Some insight into the local structure around the As atom can be obtained from comparison of Fourier transforms of the EXAFS signal (Figure 7) even before a detailed quantitative analysis is performed. In the spectrum of scorodite, two distinct peaks represent the contributions of the first two shells of neighbours around the As atom (Kitahama et al., 1975). In the spectra of the soil samples, only the first peak of the nearest coordination shell is similar to that in the mineral, while the characteristic strong peak of the second shell is absent. This indicates that As in the soil samples is not in the form of crystalline scorodite, as earlier confirmed by XRD analysis.
weighted EXAFS spectra of the soil samples and the reference As(V) mineral scorodite are shown in Figure 6, together with the best fit EXAFS models. Some insight into the local structure around the As atom can be obtained from comparison of Fourier transforms of the EXAFS signal (Figure 7) even before a detailed quantitative analysis is performed. In the spectrum of scorodite, two distinct peaks represent the contributions of the first two shells of neighbours around the As atom (Kitahama et al., 1975). In the spectra of the soil samples, only the first peak of the nearest coordination shell is similar to that in the mineral, while the characteristic strong peak of the second shell is absent. This indicates that As in the soil samples is not in the form of crystalline scorodite, as earlier confirmed by XRD analysis.
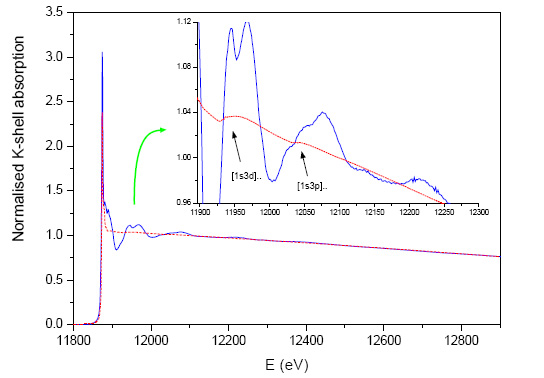
Figure 3: The normalised As K-edge absorption spectrum of scorodite (blue -solid line) and the normalised As K-edge atomic absorption background spectrum (red -dashed line) determined from the absorption measurements on arsine gas AsH![]() , by removing the ab initio calculated weak structural signal of the hydrogen atoms [14,15]. The measured atomic background incorporates all the collective intraatomic effects, including the sharp features of the multielectron excitations [1s3d] and [1s3p] which cannot be adequately described by a standard spline ansatz and may introduce systematic errors in the EXAFS analysis if not taken into account.
, by removing the ab initio calculated weak structural signal of the hydrogen atoms [14,15]. The measured atomic background incorporates all the collective intraatomic effects, including the sharp features of the multielectron excitations [1s3d] and [1s3p] which cannot be adequately described by a standard spline ansatz and may introduce systematic errors in the EXAFS analysis if not taken into account.
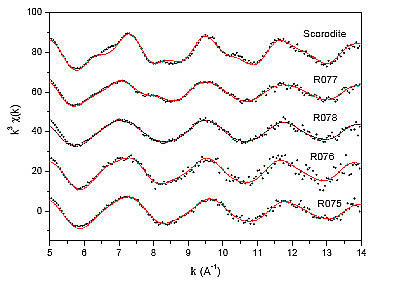
Figure 6: The k![]() weighted As K-edge EXAFS spectra of the soil samples and the reference mineralb scorodite; experimental data (dots) and best-fits (solid lines). The spectra are displaced vertically for clarity.
weighted As K-edge EXAFS spectra of the soil samples and the reference mineralb scorodite; experimental data (dots) and best-fits (solid lines). The spectra are displaced vertically for clarity.
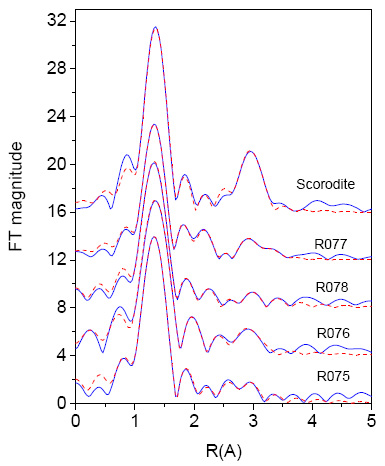
Figure 7: The k![]() weighted Fourier transform magnitude of As K-edge EXAFS spectra of the soil samples and the reference mineral scorodite calculated in the k range of Figure 6: experimental data (blue -solid line) and EXAFS model (red -dashed line). The spectra are displaced for clarity.
weighted Fourier transform magnitude of As K-edge EXAFS spectra of the soil samples and the reference mineral scorodite calculated in the k range of Figure 6: experimental data (blue -solid line) and EXAFS model (red -dashed line). The spectra are displaced for clarity.
Structural parameters of the local As neighbourhood (type and average number of neighbours, the radii and Debye-Waller factors of nearest neighbour shells) are quantitatively resolved from these spectra by comparing the measured signals with model signals, constructed ab initio with the FEFF6 program code (Rehr et al., 1992) from the set of scattering paths of the photoelectron in a tentative spatial distribution of neighbor atoms. In the initial step, the spectrum of the crystalline scorodite sample was analyzed.. A FEFF model based on the crystal structure of scorodite was constructed from crystallographic data (Kitahama et al., 1975): As(V) is coordinated to four oxygen atoms at a distance of 1.68![]() in the first coordination shell, while the second coordination shell is composed of four Fe atoms located at distances from 3.35
in the first coordination shell, while the second coordination shell is composed of four Fe atoms located at distances from 3.35![]() to 3.38
to 3.38![]() and two oxygen atoms, one at 3.24
and two oxygen atoms, one at 3.24![]() and one, belonging to an OH group, at
and one, belonging to an OH group, at
3.35![]() . The FEFF model comprises all single scattering paths and all six significant (triangular As-O-O) multiple scattering paths up to 3.4
. The FEFF model comprises all single scattering paths and all six significant (triangular As-O-O) multiple scattering paths up to 3.4![]() . The model, yields a very good fit of the scorodite EXAFS spectrum in the k range of 5
. The model, yields a very good fit of the scorodite EXAFS spectrum in the k range of 5![]() - 14
- 14![]() for the region from R = 1.1
for the region from R = 1.1![]() to 3.3
to 3.3![]() (Figures 6 and 7) with six variable parameters: the amplitude reduction factor S0
(Figures 6 and 7) with six variable parameters: the amplitude reduction factor S0![]() , the zero-energy shift
, the zero-energy shift ![]() E
E![]() , the interatomic distances R
, the interatomic distances R![]() and R
and R![]() , and the corresponding Debye-Waller factors (
, and the corresponding Debye-Waller factors (![]()
![]() and
and ![]()
![]() ). The shell coordination numbers were fixed at their crystallographicvalues and the Debye-Waller factors of the the relatively week multiple scattering paths were estimated by 1.5 times the value of
). The shell coordination numbers were fixed at their crystallographicvalues and the Debye-Waller factors of the the relatively week multiple scattering paths were estimated by 1.5 times the value of ![]()
![]() of the first coordinaton shell. Best fit values of the structural parameters, listed in Table 2, are in good agreement with previous EXAFS results for scorodite (Brown et al., 1999; Savage et al., 2000). The contribution of oxygen atoms in the second coordination shell was found to be negligibly small due to large static disorder (large Debye-Waller factors) and is therefore not listed in the table.
of the first coordinaton shell. Best fit values of the structural parameters, listed in Table 2, are in good agreement with previous EXAFS results for scorodite (Brown et al., 1999; Savage et al., 2000). The contribution of oxygen atoms in the second coordination shell was found to be negligibly small due to large static disorder (large Debye-Waller factors) and is therefore not listed in the table.
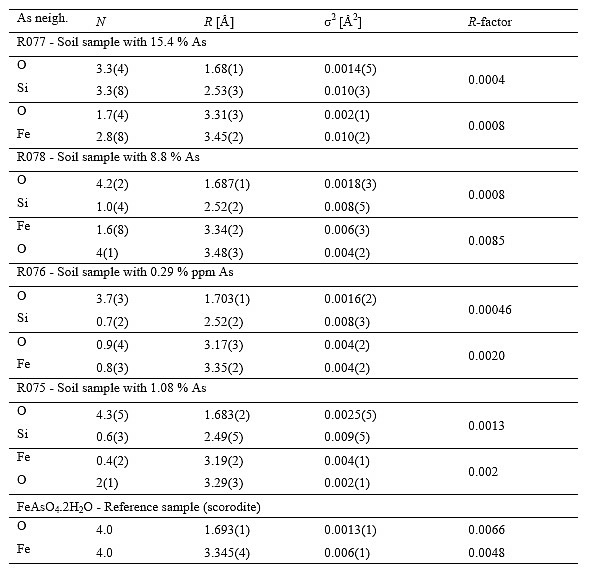
Table 2: Parameters of the nearest coordination shells around As atoms in the soil samples R075, R076, R077 and R078, and reference mineral scorodite FeAsO![]() .2H
.2H![]() O: average number of neighbour atoms (N), distance (R), and Debye-Waller factor (
O: average number of neighbour atoms (N), distance (R), and Debye-Waller factor (![]() ). Uncertainty of the last digit is given in parentheses. A best fit is obtained with the amplitude reduction factor So
). Uncertainty of the last digit is given in parentheses. A best fit is obtained with the amplitude reduction factor So![]() = 0.78
= 0.78 ![]() 0.05. In the case of fluorescence measurements (samples R075 and R076) an additional self-absorption amplitude factor of 1.14 was taken into account. The goodness-of-fit parameter, R-factor (Stern et al., 1995), obtained in the separate fit of first and second coordination shell, is given in the last column.
0.05. In the case of fluorescence measurements (samples R075 and R076) an additional self-absorption amplitude factor of 1.14 was taken into account. The goodness-of-fit parameter, R-factor (Stern et al., 1995), obtained in the separate fit of first and second coordination shell, is given in the last column.
In modelling the EXAFS spectra of the soil samples, where mixed As species are expected, different ad-hoc FEFF models were constructed (taking into account the results of elemental analysis and XANES) and compared to the measured spectra in a best fit procedure. The atomic species of neighbors in consecutive neighbor shells were recognized by their specific scattering factors and phase shifts. The model that gives very good fit of the soil EXAFS spectra comprises four shells of As neighbors: O atoms in the nearest and Si, Fe and O in more distan coordination shells. Best fit parameters (N, R and ![]() ) of each shell are listed in Table 2. Relatively large uncertainties for the coordination numbers and Debye-Waller factors, expecilay of the two most distant shels (O and Fe), are due to large correlatons between fiting parameters (N and
) of each shell are listed in Table 2. Relatively large uncertainties for the coordination numbers and Debye-Waller factors, expecilay of the two most distant shels (O and Fe), are due to large correlatons between fiting parameters (N and ![]() ) of these shells.
) of these shells.
In case of R077 and R078 spectra, measured in transmission mode, the amplitude reduction factor was kept fixed during the fit at the value obtained for scorodite (So![]() = 0.78). Self-absorption effects in the fluorescence measurement mode, which reduce the EXAFS amplitude, were taken into account for samples R075 and R076 using an additional amplitude factor of 1.14, as estimated for the given experimental setup by the program code ATOMS (Ravel, 2001).
= 0.78). Self-absorption effects in the fluorescence measurement mode, which reduce the EXAFS amplitude, were taken into account for samples R075 and R076 using an additional amplitude factor of 1.14, as estimated for the given experimental setup by the program code ATOMS (Ravel, 2001).
In all soil samples oxygen atoms were identified in the first coordination shell with a rather small radius in the range of 1.68 - 1.70![]() and a low Debye-Waller factor (about 0.002
and a low Debye-Waller factor (about 0.002![]()
![]() or lower), characteristic for a tight As(V)-O bond as also found in scorodite. However, the number of neighbours varied from 3.3 for sample R077, to 4.3 for sample R075. The lower than expected coordination number, in particular for sample R077, may be the result of the presence of some Fe
or lower), characteristic for a tight As(V)-O bond as also found in scorodite. However, the number of neighbours varied from 3.3 for sample R077, to 4.3 for sample R075. The lower than expected coordination number, in particular for sample R077, may be the result of the presence of some Fe![]() (As(AsO
(As(AsO![]() )
)![]() ) (22% from sequential extraction experiments), and may be explained by the crystal structure of the compound (D'Yvoire and Nguyen Huy-Dung, 1979). It has seven different As sites in the unit cell, of which four sites are declared as As
) (22% from sequential extraction experiments), and may be explained by the crystal structure of the compound (D'Yvoire and Nguyen Huy-Dung, 1979). It has seven different As sites in the unit cell, of which four sites are declared as As![]() and three as As
and three as As![]() ; on the As
; on the As![]() sites As is coordinated with three oxygen atoms and on the
sites As is coordinated with three oxygen atoms and on the
As![]() sites with four, leading to a somewhat lower coordination number for oxygen in sample R077.
sites with four, leading to a somewhat lower coordination number for oxygen in sample R077.
Iron atoms in samples R077 and R078 are clearly identified in the second coordination shell at a distance of 3.45![]() and 3.34
and 3.34![]() , respectively. For samples R075 and R076, with lower As concentration, the presence of Fe is also indicated, but their average coordination number is very low (about 0.5) which is already at the detection limit (slightly above the noise level of the measured spectra). Samples R077 and R078 have higher coordination numbers for Fe but the number of Fe neighbours is significantly lower than in the crystal structure of scorodite and also the Debye-Waller factors are significantly larger. This suggests that arsenic, as arsenate, is present in the form of amorphous or poorly-crystalline hydrous oxides of Fe. Surface complexation of arsenate onto hydrous oxides of Fe is a logical assumption, the more that
, respectively. For samples R075 and R076, with lower As concentration, the presence of Fe is also indicated, but their average coordination number is very low (about 0.5) which is already at the detection limit (slightly above the noise level of the measured spectra). Samples R077 and R078 have higher coordination numbers for Fe but the number of Fe neighbours is significantly lower than in the crystal structure of scorodite and also the Debye-Waller factors are significantly larger. This suggests that arsenic, as arsenate, is present in the form of amorphous or poorly-crystalline hydrous oxides of Fe. Surface complexation of arsenate onto hydrous oxides of Fe is a logical assumption, the more that ![]() -Fe
-Fe![]() O
O![]() was found by XRD. A bidentate linkage between AsO
was found by XRD. A bidentate linkage between AsO![]() and an Fe(OH)
and an Fe(OH)![]() octahedron, as found for adsorption on reactive sites of hydrous oxides of Fe, has been reported with an As-Fe distance of 3.2
octahedron, as found for adsorption on reactive sites of hydrous oxides of Fe, has been reported with an As-Fe distance of 3.2 ![]() (O'Reilly et al. 2001; Sherman and Randall, 2003). The fact that we find somewhat longer distances, 3.45
(O'Reilly et al. 2001; Sherman and Randall, 2003). The fact that we find somewhat longer distances, 3.45![]() for sample R077 and 3.34
for sample R077 and 3.34![]() for sample R078, is probably due to the fact that in the EXAFS model we introduced only one average As-Fe distance. The presence of crystalline iron arsenate (Fe
for sample R078, is probably due to the fact that in the EXAFS model we introduced only one average As-Fe distance. The presence of crystalline iron arsenate (Fe![]() (As(AsO)
(As(AsO)![]() )
)![]() ) in these samples, with longer average As-Fe distances (D'Yvoire and Nguyen Huy-Dung, 1979) than found for arsenate adsorption onto hydrous oxides of Fe, yields slightly longer average distances in the fit, depending on the fraction of crystalline iron arsenate present.
) in these samples, with longer average As-Fe distances (D'Yvoire and Nguyen Huy-Dung, 1979) than found for arsenate adsorption onto hydrous oxides of Fe, yields slightly longer average distances in the fit, depending on the fraction of crystalline iron arsenate present.
In addition, we found a shell of neighbours at a distance of 2.54![]() , composed of Al or Si atoms. The ambiguity in shell composition is due to the fact that neighbours with close atomic numbers as Al and Si cannot be unambigously distinguished by EXAFS spectroscopy. Relatively short As-Al or As-Si interatomic distances indicates adsorption of As to aluminum or silicon oxide minerals (Arai et al., 2001; Foster et al., 1998). Considering reported As-Al and As-Si distances in different possible structural configurations, some posibilities can be excluded as discussed below. The As-Al distances for an As
, composed of Al or Si atoms. The ambiguity in shell composition is due to the fact that neighbours with close atomic numbers as Al and Si cannot be unambigously distinguished by EXAFS spectroscopy. Relatively short As-Al or As-Si interatomic distances indicates adsorption of As to aluminum or silicon oxide minerals (Arai et al., 2001; Foster et al., 1998). Considering reported As-Al and As-Si distances in different possible structural configurations, some posibilities can be excluded as discussed below. The As-Al distances for an As![]() O
O![]() tetrahedron bonded to two adjacent O atoms of edgeshared AlO
tetrahedron bonded to two adjacent O atoms of edgeshared AlO![]() octahedra (representative of a reactive site on gibbsite [Al(OH)
octahedra (representative of a reactive site on gibbsite [Al(OH)![]() ] or an aluminosilicate mineral) are much longer, viz. 3.2
] or an aluminosilicate mineral) are much longer, viz. 3.2![]() (Foster et al., 1998); also in the case of an As
(Foster et al., 1998); also in the case of an As![]() O
O![]() tetrahedron bonded to an AlO
tetrahedron bonded to an AlO![]() octahedron (representative of possible sorption sites on clay minerals) the As-Al distance is longer (3.6
octahedron (representative of possible sorption sites on clay minerals) the As-Al distance is longer (3.6![]() ) than the one we found in our samples. Furthermore, EXAFS analyses by Arai and Sparks (Arai and Sparks, 2002) showed that on aged As(V) reacted aluminum oxide, As-Al interatomic distances were 3.11-3.14
) than the one we found in our samples. Furthermore, EXAFS analyses by Arai and Sparks (Arai and Sparks, 2002) showed that on aged As(V) reacted aluminum oxide, As-Al interatomic distances were 3.11-3.14![]() , suggesting bidentate binuclear bonding environments; the aluminum arsenate reference mineral mansfieldite (AlAsO
, suggesting bidentate binuclear bonding environments; the aluminum arsenate reference mineral mansfieldite (AlAsO![]() .2H
.2H![]() O) had an As(V)-Al interatomic distance of 3.15
O) had an As(V)-Al interatomic distance of 3.15![]() . There is only one structural type with an As-Al distance as short as the one we found, viz. As(V)-Al bidentate mononuclear complexation having an As-Al distance between 2.07 and 2.64
. There is only one structural type with an As-Al distance as short as the one we found, viz. As(V)-Al bidentate mononuclear complexation having an As-Al distance between 2.07 and 2.64![]() (Arai et al., 2001), which cannot be excluded by EXAFS. A similar situation is found for As-Si correlations; among the possible structures only As
(Arai et al., 2001), which cannot be excluded by EXAFS. A similar situation is found for As-Si correlations; among the possible structures only As![]() O
O![]() bonded to an SiO
bonded to an SiO![]() tetrahedron (representative for sorption on the surface of illite [hydrous aluminous silicates] or quartz), with an As-Si distance of 2.6
tetrahedron (representative for sorption on the surface of illite [hydrous aluminous silicates] or quartz), with an As-Si distance of 2.6![]() (Foster et al., 1998), seems to agree with our found As-Si distance of 2.54
(Foster et al., 1998), seems to agree with our found As-Si distance of 2.54![]() . Since large amounts of quartz have been detected by XRD in our samples, the adsorption of As(V) tetrahedra to quartz seems highly probable. The presence of Ca or Mg atoms, possible candidates for the nearest As coordination shells, is excluded by the fit. Oxygen atoms are found in the second As coordination sphere at distances from about 3.2
. Since large amounts of quartz have been detected by XRD in our samples, the adsorption of As(V) tetrahedra to quartz seems highly probable. The presence of Ca or Mg atoms, possible candidates for the nearest As coordination shells, is excluded by the fit. Oxygen atoms are found in the second As coordination sphere at distances from about 3.2![]() to 3.5
to 3.5![]() in all soil samples. The sulphur atoms as a candidate for As neighbors are ruled out by elemental analysis (Table 1), which shows that the amount of sulphur in the soils is negligible (<0.05%). In addition, EXAFS models with sulphur atoms as As neighbors do not fit the data.
in all soil samples. The sulphur atoms as a candidate for As neighbors are ruled out by elemental analysis (Table 1), which shows that the amount of sulphur in the soils is negligible (<0.05%). In addition, EXAFS models with sulphur atoms as As neighbors do not fit the data.
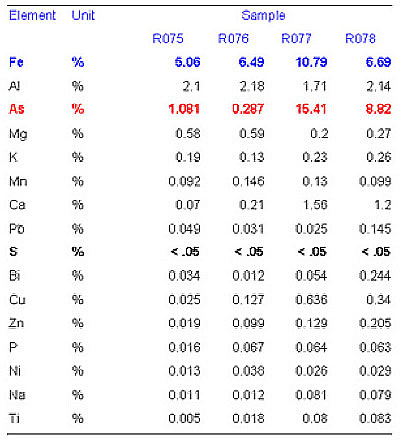
Table 1: Elemental analysis of the soil samples. Main minerals: quartz and Fe oxides
|
|
|||||||||||||||||||||||||||||||||||||||||||||||||||||||||||
|
E-mail:iztok.arcon@p-ng.si Last change: 28-Jun-2006 |
|||||||||||||||||||||||||||||||||||||||||||||||||||||||||||